

Investigating population stratification and admixture using eigenanalysis of dense genotypes
- PMID: 21448230
- PMCID: PMC3128175
- DOI: 10.1038/hdy.2011.26
Investigating population stratification and admixture using eigenanalysis of dense genotypes
Abstract
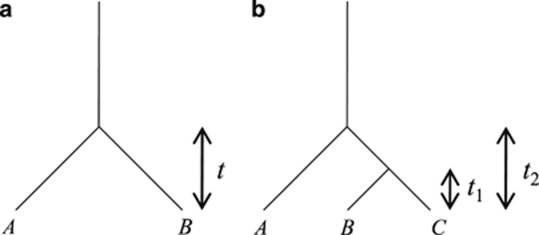
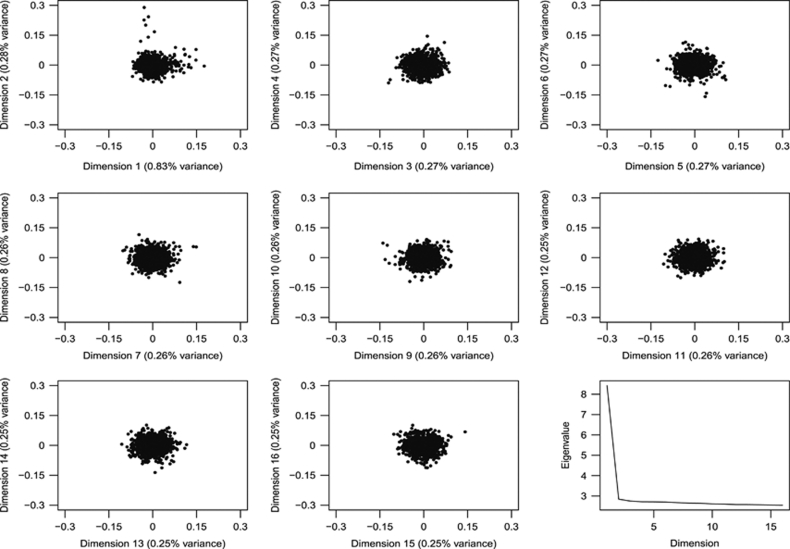
Principal components analysis of genetic data is used to avoid inflation in type I error rates in association testing due to population stratification by covariate adjustment using the top eigenvectors and to estimate cluster or group membership independent of self-reported or ethnic identities. Eigendecomposition transforms correlated variables into an equal number of uncorrelated variables. Numerous stopping rules have been developed to identify which principal components should be retained. Recent developments in random matrix theory have led to a formal hypothesis test of the top eigenvalue, providing another way to achieve dimension reduction. In this study, I compare Velicer's minimum average partial test to a test on the basis of Tracy-Widom distribution as implemented in EIGENSOFT, the most widely used implementation of principal components analysis in genome-wide association analysis. By computer simulation of vicariance on the basis of coalescent theory, EIGENSOFT systematically overestimates the number of significant principal components. Furthermore, this overestimation is larger for samples of admixed individuals than for samples of unadmixed individuals. Overestimating the number of significant principal components can potentially lead to a loss of power in association testing by adjusting for unnecessary covariates and may lead to incorrect inferences about group differentiation. Velicer's minimum average partial test is shown to have both smaller bias and smaller variance, often with a mean squared error of 0, in estimating the number of principal components to retain. Velicer's minimum average partial test is implemented in R code and is suitable for genome-wide genotype data with or without population labels.
Figures
Similar articles
-
Improved eigenanalysis of discrete subpopulations and admixture using the minimum average partial test.Hum Hered. 2012;73(2):73-83. doi: 10.1159/000335899. Epub 2012 Mar 20. Hum Hered. 2012. PMID: 22441298 Free PMC article.
-
Selecting SNPs informative for African, American Indian and European Ancestry: application to the Family Investigation of Nephropathy and Diabetes (FIND).BMC Genomics. 2016 May 4;17:325. doi: 10.1186/s12864-016-2654-x. BMC Genomics. 2016. PMID: 27142425 Free PMC article.
-
A practical approach to adjusting for population stratification in genome-wide association studies: principal components and propensity scores (PCAPS).Stat Appl Genet Mol Biol. 2018 Dec 4;17(6):/j/sagmb.2018.17.issue-6/sagmb-2017-0054/sagmb-2017-0054.xml. doi: 10.1515/sagmb-2017-0054. Stat Appl Genet Mol Biol. 2018. PMID: 30507552 Free PMC article.
-
Single Marker Family-Based Association Analysis Not Conditional on Parental Information.Methods Mol Biol. 2017;1666:409-439. doi: 10.1007/978-1-4939-7274-6_20. Methods Mol Biol. 2017. PMID: 28980257 Review.
-
Folic acid supplementation and malaria susceptibility and severity among people taking antifolate antimalarial drugs in endemic areas.Cochrane Database Syst Rev. 2022 Feb 1;2(2022):CD014217. doi: 10.1002/14651858.CD014217. Cochrane Database Syst Rev. 2022. PMID: 36321557 Free PMC article.
Cited by
-
Variation in APOL1 Contributes to Ancestry-Level Differences in HDLc-Kidney Function Association.Int J Nephrol. 2012;2012:748984. doi: 10.1155/2012/748984. Epub 2012 Sep 2. Int J Nephrol. 2012. PMID: 22973513 Free PMC article.
-
Population Genomics Reveals Local Adaptation Related to Temperature Variation in Two Stream Frog Species: Implications for Vulnerability to Climate Warming.Mol Ecol. 2025 Jan 17:e17651. doi: 10.1111/mec.17651. Online ahead of print. Mol Ecol. 2025. PMID: 39825598
-
Mapping the genomic architecture of adaptive traits with interspecific introgressive origin: a coalescent-based approach.BMC Genomics. 2016 Jan 11;17 Suppl 1(Suppl 1):8. doi: 10.1186/s12864-015-2298-2. BMC Genomics. 2016. PMID: 26819241 Free PMC article.
-
Genome-wide genotype and sequence-based reconstruction of the 140,000 year history of modern human ancestry.Sci Rep. 2014 Aug 13;4:6055. doi: 10.1038/srep06055. Sci Rep. 2014. PMID: 25116736 Free PMC article.
-
APOL1 G1 genotype modifies the association between HDLC and kidney function in African Americans.BMC Genomics. 2015 May 30;16(1):421. doi: 10.1186/s12864-015-1645-7. BMC Genomics. 2015. PMID: 26025194 Free PMC article.
References
Publication types
MeSH terms
Grants and funding
LinkOut - more resources
Full Text Sources
