Human primary adipocytes exhibit immune cell function: adipocytes prime inflammation independent of macrophages
- PMID: 21448265
- PMCID: PMC3063154
- DOI: 10.1371/journal.pone.0017154
Human primary adipocytes exhibit immune cell function: adipocytes prime inflammation independent of macrophages
Abstract
Background: Obesity promotes inflammation in adipose tissue (AT) and this is implicated in pathophysiological complications such as insulin resistance, type 2 diabetes and cardiovascular disease. Although based on the classical hypothesis, necrotic AT adipocytes (ATA) in obese state activate AT macrophages (ATM) that then lead to a sustained chronic inflammation in AT, the link between human adipocytes and the source of inflammation in AT has not been in-depth and systematically studied. So we decided as a new hypothesis to investigate human primary adipocytes alone to see whether they are able to prime inflammation in AT.
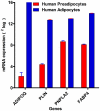
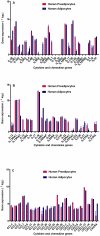
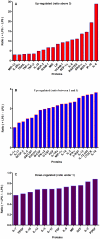
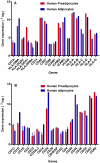
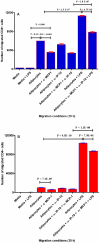
Methods and results: Using mRNA expression, human preadipocytes and adipocytes express the cytokines/chemokines and their receptors, MHC II molecule genes and 14 acute phase reactants including C-reactive protein. Using multiplex ELISA revealed the expression of 50 cytokine/chemokine proteins by human adipocytes. Upon lipopolysaccharide stimulation, most of these adipocyte-associated cytokines/chemokines and immune cell modulating receptors were up-regulated and a few down-regulated such as (ICAM-1, VCAM-1, MCP-1, IP-10, IL-6, IL-8, TNF-α and TNF-β highly up-regulated and IL-2, IL-7, IL-10, IL-13 and VEGF down-regulated. In migration assay, human adipocyte-derived chemokines attracted significantly more CD4+ T cells than controls and the number of migrated CD4+ cells was doubled after treating the adipocytes with LPS. Neutralizing MCP-1 effect produced by adipocytes reduced CD4+ migration by approximately 30%.
Conclusion: Human adipocytes express many cytokines/chemokines that are biologically functional. They are able to induce inflammation and activate CD4+ cells independent of macrophages. This suggests that the primary event in the sequence leading to chronic inflammation in AT is metabolic dysfunction in adipocytes, followed by production of immunological mediators by these adipocytes, which is then exacerbated by activated ATM, activation and recruitment of immune cells. This study provides novel knowledge about the prime of inflammation in human obese adipose tissue, opening a new avenue of investigations towards obesity-associated type 2 diabetes.
Conflict of interest statement
Figures




Similar articles
-
Dietary long-chain n-3 PUFAs mitigate CD4+ T cell/adipocyte inflammatory interactions in co-culture models of obese adipose tissue.J Nutr Biochem. 2020 Dec;86:108488. doi: 10.1016/j.jnutbio.2020.108488. Epub 2020 Aug 19. J Nutr Biochem. 2020. PMID: 32827664
-
Standard isolation of primary adipose cells from mouse epididymal fat pads induces inflammatory mediators and down-regulates adipocyte genes.J Biol Chem. 2003 Nov 28;278(48):47585-93. doi: 10.1074/jbc.M305257200. Epub 2003 Sep 15. J Biol Chem. 2003. PMID: 12975378
-
Preadipocytes mediate lipopolysaccharide-induced inflammation and insulin resistance in primary cultures of newly differentiated human adipocytes.Endocrinology. 2006 Nov;147(11):5340-51. doi: 10.1210/en.2006-0536. Epub 2006 Jul 27. Endocrinology. 2006. PMID: 16873530
-
Adipocyte-Macrophage Cross-Talk in Obesity.Adv Exp Med Biol. 2017;960:327-343. doi: 10.1007/978-3-319-48382-5_14. Adv Exp Med Biol. 2017. PMID: 28585206 Review.
-
The "Big Bang" in obese fat: Events initiating obesity-induced adipose tissue inflammation.Eur J Immunol. 2015 Sep;45(9):2446-56. doi: 10.1002/eji.201545502. Epub 2015 Aug 19. Eur J Immunol. 2015. PMID: 26220361 Review.
Cited by
-
Chito-oligosaccharide inhibits the de-methylation of a 'CpG' island within the leptin (LEP) promoter during adipogenesis of 3T3-L1 cells.PLoS One. 2013;8(3):e60011. doi: 10.1371/journal.pone.0060011. Epub 2013 Mar 27. PLoS One. 2013. PMID: 23544120 Free PMC article.
-
The outliers become a stampede as immunometabolism reaches a tipping point.Immunol Rev. 2012 Sep;249(1):253-75. doi: 10.1111/j.1600-065X.2012.01142.x. Immunol Rev. 2012. PMID: 22889227 Free PMC article. Review.
-
Tissue Tregs.Annu Rev Immunol. 2016 May 20;34:609-33. doi: 10.1146/annurev-immunol-032712-095948. Annu Rev Immunol. 2016. PMID: 27168246 Free PMC article. Review.
-
Endothelial Dysfunction in Obesity and Therapeutic Targets.Adv Exp Med Biol. 2024;1460:489-538. doi: 10.1007/978-3-031-63657-8_17. Adv Exp Med Biol. 2024. PMID: 39287863 Review.
-
Metformin Suppresses MHC-Restricted Antigen Presentation by Inhibiting Co-Stimulatory Factors and MHC Molecules in APCs.Biomol Ther (Seoul). 2013 Jan;21(1):35-41. doi: 10.4062/biomolther.2012.094. Biomol Ther (Seoul). 2013. PMID: 24009856 Free PMC article.
References
-
- Scherer PE. Adipose tissue: from lipid storage compartment to endocrine organ. Diabetes. 2006;55:1537–1545. - PubMed
-
- Tzanavari T, Bing C, Trayhurn P. Postnatal expression of zinc-alpha2-glycoprotein in rat white and brown adipose tissue. Mol Cell Endocrinol. 2007;279:26–33. - PubMed
-
- Friedman JM, Halaas JL. Leptin and the regulation of body weight in mammals. Nature. 1998;395:763–770. - PubMed
-
- Considine RV, Caro JF. Leptin in humans: current progress and future directions. Clin Chem. 1996;42:843–844. - PubMed
Publication types
MeSH terms
Substances
LinkOut - more resources
Full Text Sources
Other Literature Sources
Medical
Research Materials
Miscellaneous

