

Gene expression profiles in stage I uterine serous carcinoma in comparison to grade 3 and grade 1 stage I endometrioid adenocarcinoma
- PMID: 21448288
- PMCID: PMC3063241
- DOI: 10.1371/journal.pone.0018066
Gene expression profiles in stage I uterine serous carcinoma in comparison to grade 3 and grade 1 stage I endometrioid adenocarcinoma
Abstract
Background: Endometrial cancer is the most common gynecologic malignancy in the developed countries. Clinical studies have shown that early stage uterine serous carcinoma (USC) has outcomes similar to early stage high grade endometrioid adenocarcinoma (EAC-G3) than to early stage low grade endometrioid adenocarcinoma (EAC-G1). However, little is known about the origin of these different clinical outcomes. This study applied the whole genome expression profiling to explore the expression difference of stage I USC (n = 11) relative to stage I EAC-G3 (n = 11) and stage I EAC-G1 (n = 11), respectively.
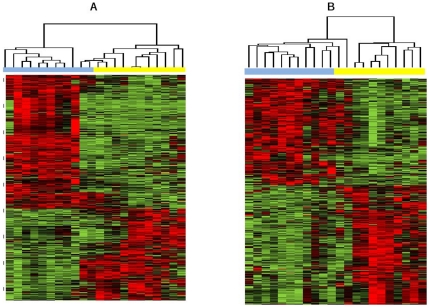
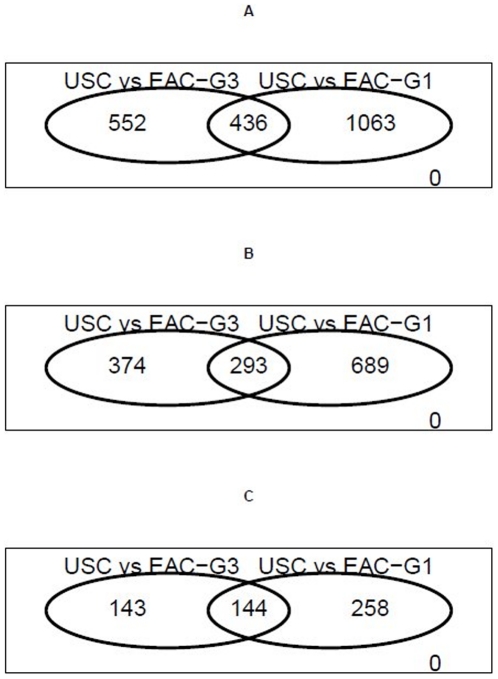
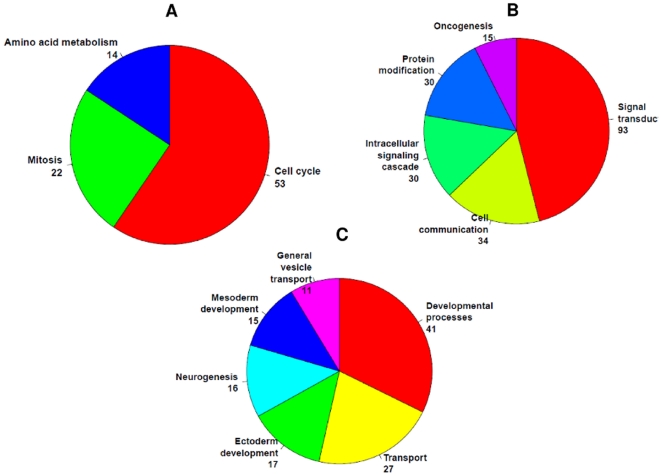
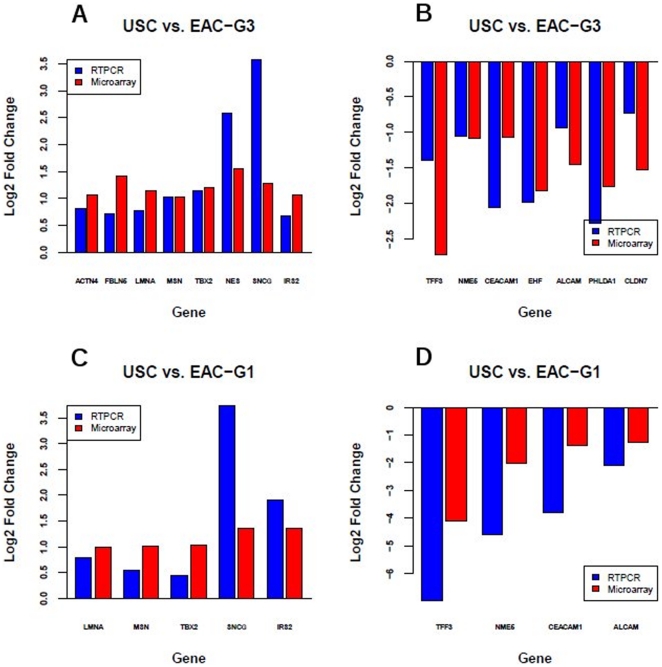
Methodology/principal finding: We found that the expression difference between USC and EAC-G3, as measured by the number of differentially expressed genes (DEGs), is consistently less than that found between USC and EAC-G1. Pathway enrichment analyses suggested that DEGs specific to USC vs. EAC-G3 are enriched for genes involved in signaling transduction, while DEGs specific to USC vs. EAC-G1 are enriched for genes involved in cell cycle. Gene expression differences for selected DEGs are confirmed by quantitative RT-PCR with a high validation rate.
Conclusion: This data, although preliminary, indicates that stage I USC is genetically similar to stage I EAC-G3 compared to stage I EAC-G1. DEGs identified from this study might provide an insight in to the potential mechanisms that influence the clinical outcome differences between endometrial cancer subtypes. They might also have potential prognostic and therapeutic impacts on patients diagnosed with uterine cancer.
Conflict of interest statement
Figures
Similar articles
-
Microarray analysis reveals distinct gene expression profiles among different tumor histology, stage and disease outcomes in endometrial adenocarcinoma.PLoS One. 2010 Nov 8;5(11):e15415. doi: 10.1371/journal.pone.0015415.s001. PLoS One. 2010. PMID: 21079744 Free PMC article.
-
IMP3 distinguishes uterine serous carcinoma from endometrial endometrioid adenocarcinoma.Am J Clin Pathol. 2010 Jun;133(6):899-908. doi: 10.1309/AJCPQDQXJ4FNRFQB. Am J Clin Pathol. 2010. PMID: 20472848
-
Alteration of PTEN expression in endometrial carcinoma is associated with down-regulation of cyclin-dependent kinase inhibitor, p27.Histopathology. 2002 Nov;41(5):437-45. doi: 10.1046/j.1365-2559.2002.01455.x. Histopathology. 2002. PMID: 12405911
-
Molecular Genetics of Endometrial Carcinoma.Annu Rev Pathol. 2019 Jan 24;14:339-367. doi: 10.1146/annurev-pathol-020117-043609. Epub 2018 Oct 17. Annu Rev Pathol. 2019. PMID: 30332563 Review.
-
HER2 in uterine serous carcinoma: Current state and clinical perspectives.Am J Clin Pathol. 2023 Oct 3;160(4):341-351. doi: 10.1093/ajcp/aqad056. Am J Clin Pathol. 2023. PMID: 37267036 Review.
Cited by
-
The role of hypoxic-inducible factor (HIF1α) and aldolaseC protein in endometrial carcinogenesis: a retrospective study of 279 patients.BMJ Open. 2012 Aug 24;2(4):e001450. doi: 10.1136/bmjopen-2012-001450. Print 2012. BMJ Open. 2012. PMID: 22923632 Free PMC article.
-
The impact of microRNA-mediated PI3K/AKT signaling on epithelial-mesenchymal transition and cancer stemness in endometrial cancer.J Transl Med. 2014 Aug 21;12:231. doi: 10.1186/s12967-014-0231-0. J Transl Med. 2014. PMID: 25141911 Free PMC article. Review.
-
Integrating pathology, chromosomal instability and mutations for risk stratification in early-stage endometrioid endometrial carcinoma.Cell Biosci. 2020 Oct 22;10:122. doi: 10.1186/s13578-020-00486-0. eCollection 2020. Cell Biosci. 2020. PMID: 33110489 Free PMC article.
-
Molecular Prognostic Factors in Uterine Serous Carcinomas: A Systematic Review.Curr Oncol. 2025 Apr 25;32(5):251. doi: 10.3390/curroncol32050251. Curr Oncol. 2025. PMID: 40422510 Free PMC article.
-
MicroRNA-101 targets EZH2, MCL-1 and FOS to suppress proliferation, invasion and stem cell-like phenotype of aggressive endometrial cancer cells.Oncotarget. 2014 Aug 15;5(15):6049-62. doi: 10.18632/oncotarget.2157. Oncotarget. 2014. PMID: 25153722 Free PMC article.
References
-
- Jemal A, Siegel R, Ward E, Hao Y, Xu J, et al. Cancer Satistics. CA cancer J Clin. 2009;59:225–249. - PubMed
-
- Soslow RA, Bissonnette JP, Wilton A, Ferguson SE, Alektiar KM, et al. Clinicopathologic analysis of 187 high-grade endometrial carcinomas of different histologic subtypes: Similar outcomes belie distinctive biologic differences. Am J Surg Pathol. 2007;31:979–87. - PubMed
-
- Kitchener HC, Trimble EL Endometrial Cancer Working Group of the Gynecoloic Cancer Intergroup. Endometrial cancer state of the science meeting. Int J Gynecol Cancer. 2009;9:134–140. - PubMed
-
- Naumann RW. Uterine papillary serous carcinoma state of the state. Current Oncology reports. 2008;10:505–511. - PubMed
-
- Benito V, Lubrano A, Arencibia O, Alvarez EE, León L, et al. Pure papillary serous tumors of the endometrium. A clinicopathological analysis of 61 cases from a single institution. Int J Gynecol Cancer. 2009;19:1364–1369. - PubMed
Publication types
MeSH terms
Substances
Grants and funding
LinkOut - more resources
Full Text Sources
Other Literature Sources
Medical
Molecular Biology Databases
Research Materials
