

Transient micro-elastography: A novel non-invasive approach to measure liver stiffness in mice
- PMID: 21448348
- PMCID: PMC3057158
- DOI: 10.3748/wjg.v17.i8.968
Transient micro-elastography: A novel non-invasive approach to measure liver stiffness in mice
Abstract
Aim: To develop and validate a transient micro-elastography device to measure liver stiffness (LS) in mice.
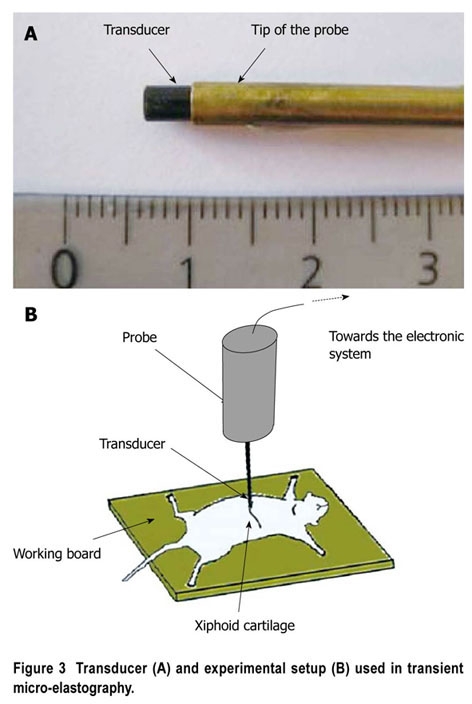
Methods: A novel transient micro-elastography (TME) device, dedicated to LS measurements in mice with a range of measurement from 1-170 kPa, was developed using an optimized vibration frequency of 300 Hz and a 2 mm piston. The novel probe was validated in a classical fibrosis model (CCl(4)) and in a transgenic murine model of systemic amyloidosis.
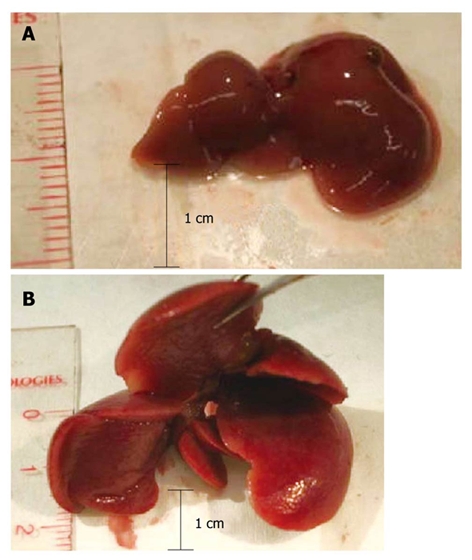
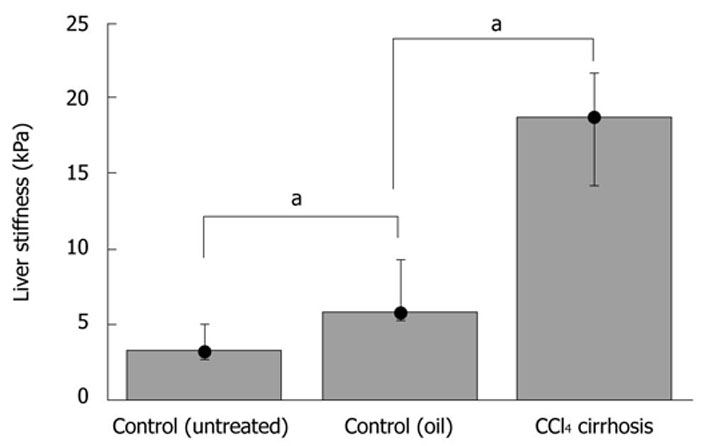
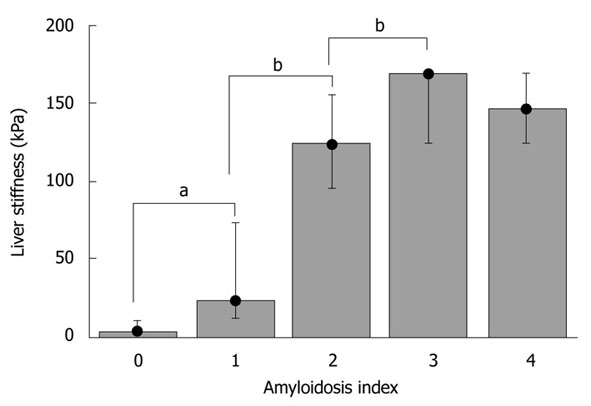
Results: TME could be successfully performed in control mice below the xiphoid cartilage, with a mean LS of 4.4 ± 1.3 kPa, a mean success rate of 88%, and an excellent intra-observer agreement (0.98). Treatment with CCl(4) over seven weeks drastically increased LS as compared to controls (18.2 ± 3.7 kPa vs 3.6 ± 1.2 kPa). Moreover, fibrosis stage was highly correlated with LS (Spearman coefficient = 0.88, P < 0.01). In the amyloidosis model, much higher LS values were obtained, reaching maximum values of > 150 kPa. LS significantly correlated with the amyloidosis index (0.93, P < 0.0001) and the plasma concentration of mutant hapoA-II (0.62, P < 0.005).
Conclusion: Here, we have established the first non-invasive approach to measure LS in mice, and have successfully validated it in two murine models of high LS.
Keywords: Amyloidosis; Fibrosis; Liver; Liver stiffness; Mice; Micro-elastography; Transient elastography; Ultrasound.
Figures

References
-
- Sandrin L, Fourquet B, Hasquenoph JM, Yon S, Fournier C, Mal F, Christidis C, Ziol M, Poulet B, Kazemi F, et al. Transient elastography: a new noninvasive method for assessment of hepatic fibrosis. Ultrasound Med Biol. 2003;29:1705–1713. - PubMed
-
- Erhardt A, Lörke J, Vogt C, Poremba C, Willers R, Sagir A, Häussinger D. [Transient elastography for diagnosing liver cirrhosis] Dtsch Med Wochenschr. 2006;131:2765–2769. - PubMed
-
- Castéra L, Vergniol J, Foucher J, Le Bail B, Chanteloup E, Haaser M, Darriet M, Couzigou P, De Lédinghen V. Prospective comparison of transient elastography, Fibrotest, APRI, and liver biopsy for the assessment of fibrosis in chronic hepatitis C. Gastroenterology. 2005;128:343–350. - PubMed
-
- Ganne-Carrié N, Ziol M, de Ledinghen V, Douvin C, Marcellin P, Castera L, Dhumeaux D, Trinchet JC, Beaugrand M. Accuracy of liver stiffness measurement for the diagnosis of cirrhosis in patients with chronic liver diseases. Hepatology. 2006;44:1511–1517. - PubMed
Publication types
MeSH terms
Substances
LinkOut - more resources
Full Text Sources
