Metabolites of purine nucleoside phosphorylase (NP) in serum have the potential to delineate pancreatic adenocarcinoma
- PMID: 21448452
- PMCID: PMC3063153
- DOI: 10.1371/journal.pone.0017177
Metabolites of purine nucleoside phosphorylase (NP) in serum have the potential to delineate pancreatic adenocarcinoma
Abstract
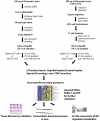
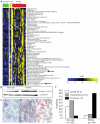
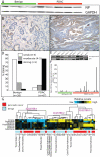
Pancreatic Adenocarcinoma (PDAC), the fourth highest cause of cancer related deaths in the United States, has the most aggressive presentation resulting in a very short median survival time for the affected patients. Early detection of PDAC is confounded by lack of specific markers that has motivated the use of high throughput molecular approaches to delineate potential biomarkers. To pursue identification of a distinct marker, this study profiled the secretory proteome in 16 PDAC, 2 carcinoma in situ (CIS) and 7 benign patients using label-free mass spectrometry coupled to 1D-SDS-PAGE and Strong Cation-Exchange Chromatography (SCX). A total of 431 proteins were detected of which 56 were found to be significantly elevated in PDAC. Included in this differential set were Parkinson disease autosomal recessive, early onset 7 (PARK 7) and Alpha Synuclein (aSyn), both of which are known to be pathognomonic to Parkinson's disease as well as metabolic enzymes like Purine Nucleoside Phosphorylase (NP) which has been exploited as therapeutic target in cancers. Tissue Microarray analysis confirmed higher expression of aSyn and NP in ductal epithelia of pancreatic tumors compared to benign ducts. Furthermore, extent of both aSyn and NP staining positively correlated with tumor stage and perineural invasion while their intensity of staining correlated with the existence of metastatic lesions in the PDAC tissues. From the biomarker perspective, NP protein levels were higher in PDAC sera and furthermore serum levels of its downstream metabolites guanosine and adenosine were able to distinguish PDAC from benign in an unsupervised hierarchical classification model. Overall, this study for the first time describes elevated levels of aSyn in PDAC as well as highlights the potential of evaluating NP protein expression and levels of its downstream metabolites to develop a multiplex panel for non-invasive detection of PDAC.
Conflict of interest statement
Figures


Similar articles
-
Distinct serum metabolomics profiles associated with malignant progression in the KrasG12D mouse model of pancreatic ductal adenocarcinoma.BMC Genomics. 2015;16 Suppl 1(Suppl 1):S1. doi: 10.1186/1471-2164-16-S1-S1. Epub 2015 Jan 15. BMC Genomics. 2015. PMID: 25923219 Free PMC article.
-
Overexpression and elevated serum levels of phosphoglycerate kinase 1 in pancreatic ductal adenocarcinoma.Proteomics. 2006 Apr;6(7):2259-72. doi: 10.1002/pmic.200500345. Proteomics. 2006. PMID: 16493704
-
Comparative proteomic analysis for the detection of biomarkers in pancreatic ductal adenocarcinomas.J Clin Pathol. 2008 Jan;61(1):49-58. doi: 10.1136/jcp.2006.044735. Epub 2007 Apr 5. J Clin Pathol. 2008. PMID: 17412869
-
Clinical Perspective on Proteomic and Glycomic Biomarkers for Diagnosis, Prognosis, and Prediction of Pancreatic Cancer.Int J Mol Sci. 2021 Mar 6;22(5):2655. doi: 10.3390/ijms22052655. Int J Mol Sci. 2021. PMID: 33800786 Free PMC article.
-
Strategies for discovering novel pancreatic cancer biomarkers.J Proteomics. 2013 Apr 9;81:126-34. doi: 10.1016/j.jprot.2012.09.025. Epub 2012 Sep 28. J Proteomics. 2013. PMID: 23026552 Free PMC article. Review.
Cited by
-
Pathway-centric integrative analysis identifies RRM2 as a prognostic marker in breast cancer associated with poor survival and tamoxifen resistance.Neoplasia. 2014 May;16(5):390-402. doi: 10.1016/j.neo.2014.05.007. Neoplasia. 2014. PMID: 25016594 Free PMC article.
-
Pathway-directed weighted testing procedures for the integrative analysis of gene expression and metabolomic data.Genomics. 2012 May;99(5):265-74. doi: 10.1016/j.ygeno.2012.03.004. Epub 2012 Apr 2. Genomics. 2012. PMID: 22497771 Free PMC article.
-
The Guanine-Based Purinergic System: The Tale of An Orphan Neuromodulation.Front Pharmacol. 2016 Jun 17;7:158. doi: 10.3389/fphar.2016.00158. eCollection 2016. Front Pharmacol. 2016. PMID: 27378923 Free PMC article. Review.
-
Purine nucleoside phosphorylase enables dual metabolic checkpoints that prevent T cell immunodeficiency and TLR7-associated autoimmunity.J Clin Invest. 2022 Aug 15;132(16):e160852. doi: 10.1172/JCI160852. J Clin Invest. 2022. PMID: 35653193 Free PMC article.
-
Bothrops Jararaca Snake Venom Modulates Key Cancer-Related Proteins in Breast Tumor Cell Lines.Toxins (Basel). 2021 Jul 25;13(8):519. doi: 10.3390/toxins13080519. Toxins (Basel). 2021. PMID: 34437390 Free PMC article.
References
-
- Jemal A, Siegel R, Ward E, Hao Y, Xu J, et al. Cancer statistics, 2009. CA Cancer J Clin. 2009;59:225–249. - PubMed
-
- Warshaw AL, Fernandez-del Castillo C. Pancreatic carcinoma. N Engl J Med. 1992;326:455–465. - PubMed
-
- Goggins M, Canto M, Hruban R. Can we screen high-risk individuals to detect early pancreatic carcinoma? J Surg Oncol. 2000;74:243–248. - PubMed
-
- Rosty C, Goggins M. Early detection of pancreatic carcinoma. Hematol Oncol Clin North Am. 2002;16:37–52. - PubMed
-
- Farrell JJ, van Rijnsoever M, Elsaleh H. Early detection markers in Pancreas Cancer. Cancer Biomark. 2005;1:157–175. - PubMed
Publication types
MeSH terms
Substances
Grants and funding
LinkOut - more resources
Full Text Sources
Medical
Miscellaneous

