. 2011 Apr;33(4):873-81.
doi: 10.1002/jmri.22514.

T(1) independent, T(2) (*) corrected chemical shift based fat-water separation with multi-peak fat spectral modeling is an accurate and precise measure of hepatic steatosis

Affiliations

T(1) independent, T(2) (*) corrected chemical shift based fat-water separation with multi-peak fat spectral modeling is an accurate and precise measure of hepatic steatosis

Catherine D G Hines et al. J Magn Reson Imaging. 2011 Apr.

Abstract

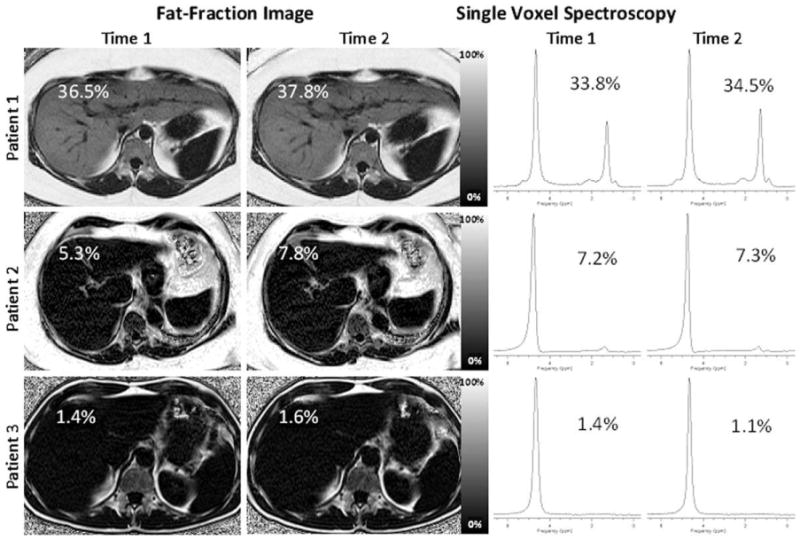
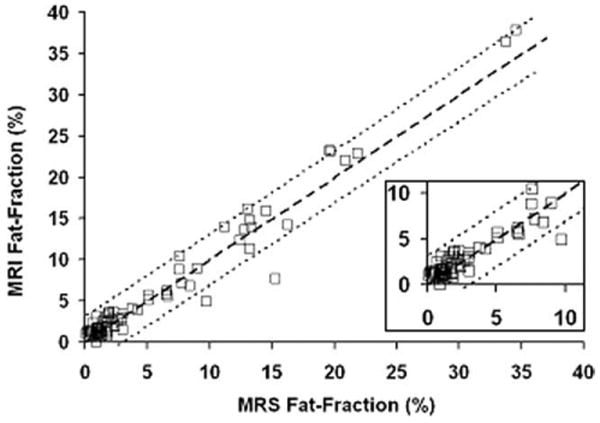
Purpose: To determine the precision and accuracy of hepatic fat-fraction measured with a chemical shift-based MRI fat-water separation method, using single-voxel MR spectroscopy (MRS) as a reference standard.

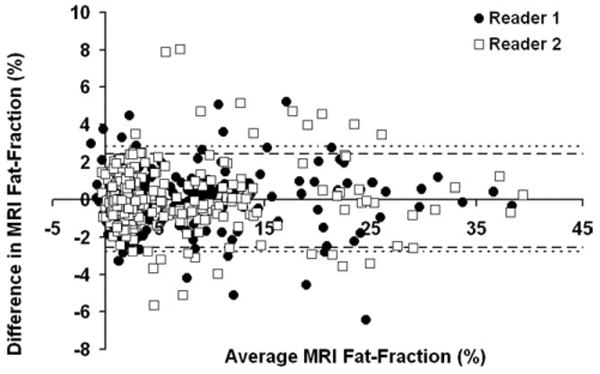
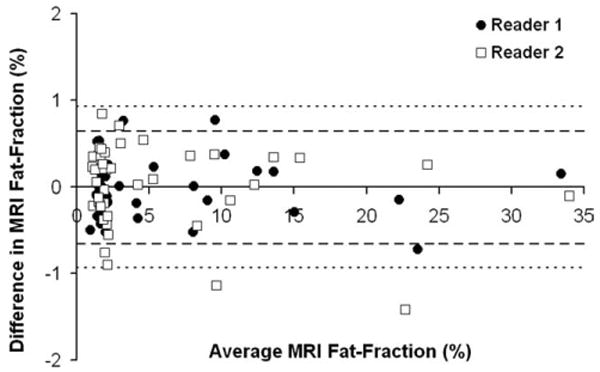
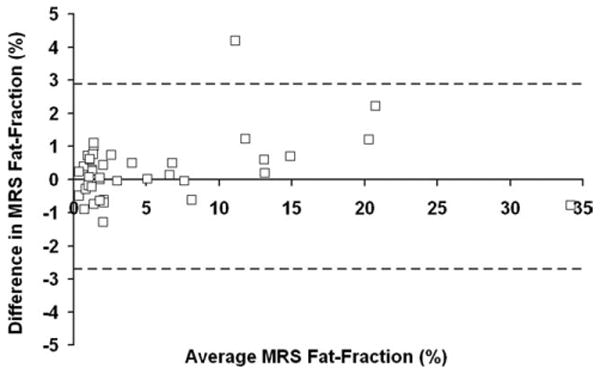
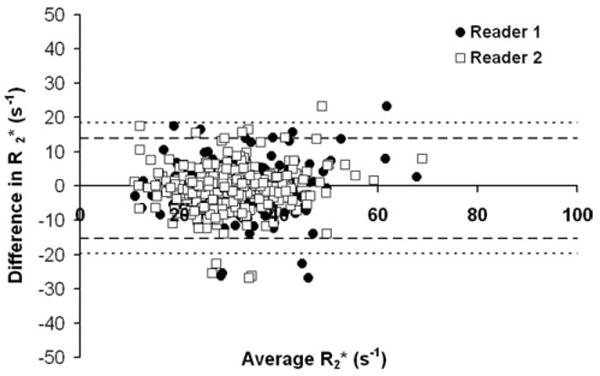
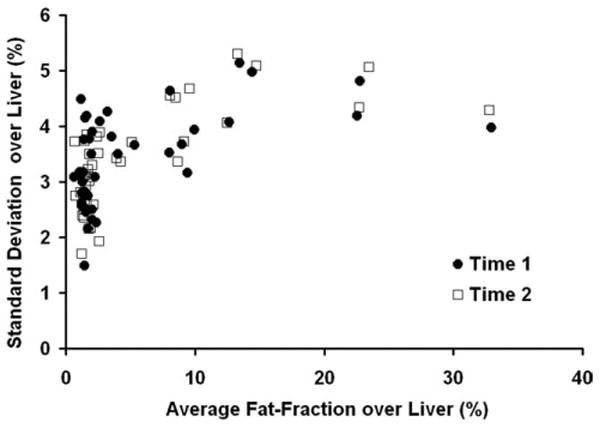
Materials and methods: In 42 patients, two repeated measurements were made using a T(1) -independent, T 2*-corrected chemical shift-based fat-water separation method with multi-peak spectral modeling of fat, and T(2) -corrected single voxel MR spectroscopy. Precision was assessed through calculation of Bland-Altman plots and concordance correlation intervals. Accuracy was assessed through linear regression between MRI and MRS. Sensitivity and specificity of MRI fat-fractions for diagnosis of steatosis using MRS as a reference standard were also calculated.

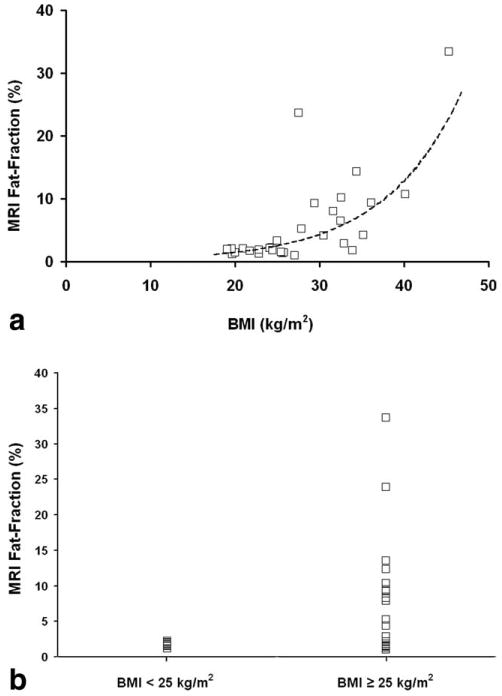
Results: Statistical analysis demonstrated excellent precision of MRI and MRS fat-fractions, indicated by 95% confidence intervals (units of absolute percent) of [-2.66%,2.64%] for single MRI ROI measurements, [-0.81%,0.80%] for averaged MRI ROI, and [-2.70%,2.87%] for single-voxel MRS. Linear regression between MRI and MRS indicated that the MRI method is highly accurate. Sensitivity and specificity for detection of steatosis using averaged MRI ROI were 100% and 94%, respectively. The relationship between hepatic fat-fraction and body mass index was examined.

Conclusion: Fat-fraction measured with T(1) -independent T 2*-corrected MRI and multi-peak spectral modeling of fat is a highly precise and accurate method of quantifying hepatic steatosis.


Figures

Figure 1
Figure 1
Representative patient fat-fraction images and MRS spectra at Time 1 and Time 2. Patient 1, Patient 2, and Patient 3 are examples of severely elevated fat-fraction, mildly elevated fat-fraction, and a normal fat-fraction, respectively. The MRI fat-fraction recorded at the location of the MRS voxel is displayed on each fat-fraction image. MRS fat-fractions are as indicated on the spectra. Excellent agreement is seen between time points for individual readers, between different readers, and between techniques.
Figure 2
Figure 2
Bland-Altman plot between Time 1 and Time 2 for the MRI fat-fractions measured in each of the Couinaud segments for all volunteers, indicating high precision. The limits of agreement for Reader 1 (circles) are [−2.54%, 2.44%], denoted as a heavy dashed line. The limits of agreement for Reader 2 (squares) are [−2.76%, 2.83%], denoted as a fine dashed line. If data from both readers is pooled, the limits of agreement are [−2.66%, 2.64%].
Figure 3
Figure 3
Bland-Altman plot between Time 1 and Time 2 for average MRI fat-fraction across the liver. The limits of agreement for Reader 1 (circles), denoted as a heavy dashed line, are [−0.66%, 0.64%] and for Reader 2 (squares), denoted as a fine dashed line, are [−0.94%, 0.93%]. If data from both readers is pooled, the limits of agreement are [−0.81%, 0.80%].
Figure 4
Figure 4
Bland-Altman plot between Time 1 and Time 2 for MRS fat-fraction. The limits of agreement are [−2.70%, 2.87%].
Figure 5
Figure 5
Bland-Altman plot between Time 1 and Time 2 for R2 measurements. The limits of agreement for Reader 1 (circles), denoted as a heavy dashed line, are [−15.19 s−1, 13.84 s−1], and for Reader 2 (squares), denoted as a fine dashed line, are [−19.67 s−1, 18.42 s−1]. If data from both readers is pooled, the limits of agreement are [−17.39 s−1, 16.23 s−1].
Figure 6
Figure 6
Standard deviation over the liver versus average fat-fraction over the liver for Reader 1 at Time 1 and Time 2. Both axes are expressed in fat-fraction percent (%). A lower variance is seen in most patients that have low fat-fractions. In general, however, the variance of measurements was relatively independent as the variance plateaus at approximately 5% for a wide range of fat-fractions.
Figure 7
Figure 7
Linear regression of MRI fat-fraction measured in the location of the MRS voxel and MRS fat-fraction indicates high accuracy. Estimated slope, intercept, and r2 value are 1.04 ± 0.02, 0.06 ± 0.21, and 0.96, respectively. The slope and intercept are not significantly different from 1.0 and 0.0, respectively. An inset zoom of the 0–10% region is shown in the lower right hand corner. Heavy dashed line is unity, and 95% confidence interval of the slope is as fine dashed lines.
Figure 8
Figure 8
a: Regression of average MRI fat-fraction and BMI displays an exponential relationship for pooled readers. Line of best fit is y = 0.165e0.1089x and r2 is 0.55. b: Comparison of average MRI fat-fraction versus patients with a BMI above and below 25 kg/m2. All patients with a BMI below 25 kg/m2 have fat-fractions that are considered normal or healthy, although a wider range of fat-fractions is seen in patients with a BMI above 25 kg/m2.

Similar articles

Cited by

References

    1. Sass DA, Chang P, Chopra KB. Nonalcoholic fatty liver disease: a clinical review. Dig Dis Sci. 2005;50:171–180. - PubMed
    1. Harrison SA, Neuschwander-Tetri BA. Nonalcoholic fatty liver disease and nonalcoholic steatohepatitis. Clin Liver Dis. 2004;8:861–879. ix. - PubMed
    1. Marchesini G, Brizi M, Bianchi G, et al. Nonalcoholic fatty liver disease: a feature of the metabolic syndrome. Diabetes. 2001;50:1844–1850. - PubMed
    1. Marchesini G, Brizi M, Morselli-Labate AM, et al. Association of nonalcoholic fatty liver disease with insulin resistance. Am J Med. 1999;107:450–455. - PubMed
    1. Brunt EM. Nonalcoholic steatohepatitis. Semin Liver Dis. 2004;24:3–20. - PubMed

Publication types