

Weight loss, exercise, or both and physical function in obese older adults
- PMID: 21449785
- PMCID: PMC3114602
- DOI: 10.1056/NEJMoa1008234
Weight loss, exercise, or both and physical function in obese older adults
Abstract
Background: Obesity exacerbates the age-related decline in physical function and causes frailty in older adults; however, the appropriate treatment for obese older adults is controversial.
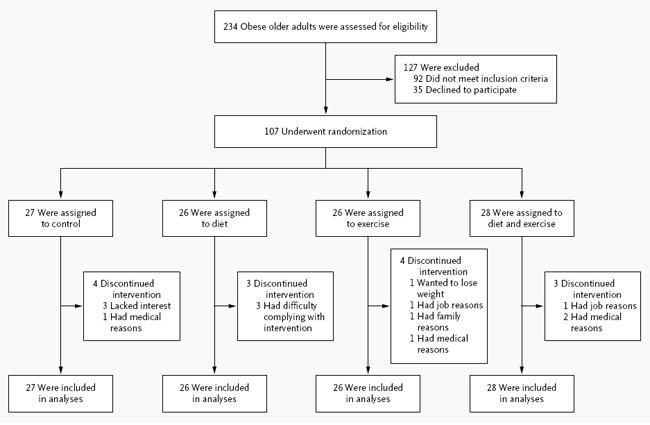
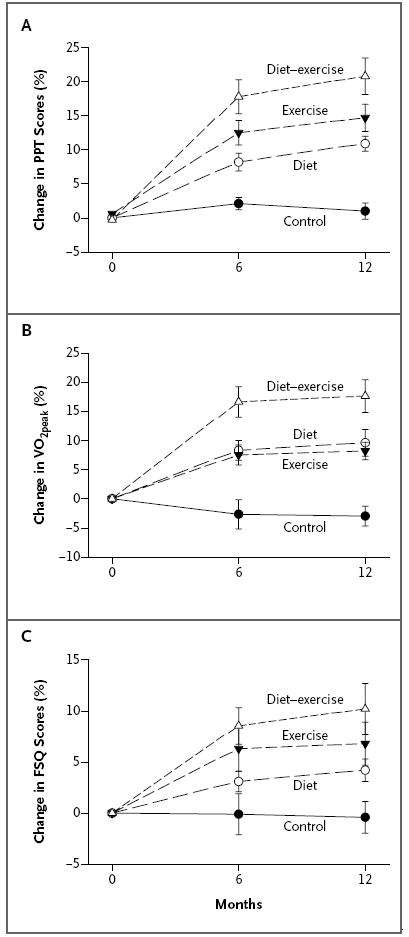
Methods: In this 1-year, randomized, controlled trial, we evaluated the independent and combined effects of weight loss and exercise in 107 adults who were 65 years of age or older and obese. Participants were randomly assigned to a control group, a weight-management (diet) group, an exercise group, or a weight-management-plus-exercise (diet-exercise) group. The primary outcome was the change in score on the modified Physical Performance Test. Secondary outcomes included other measures of frailty, body composition, bone mineral density, specific physical functions, and quality of life.
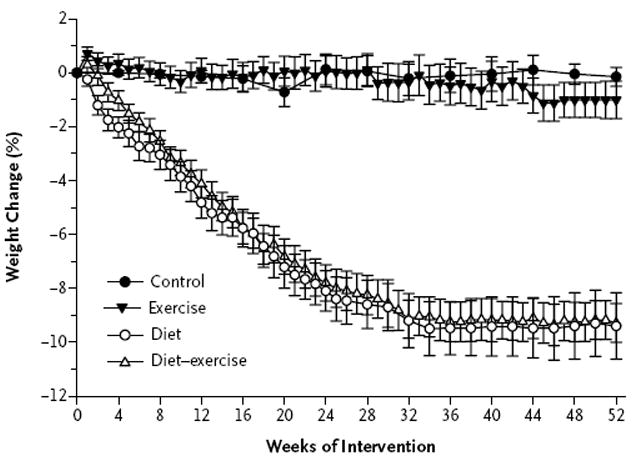
Results: A total of 93 participants (87%) completed the study. In the intention-to-treat analysis, the score on the Physical Performance Test, in which higher scores indicate better physical status, increased more in the diet-exercise group than in the diet group or the exercise group (increases from baseline of 21% vs. 12% and 15%, respectively); the scores in all three of those groups increased more than the scores in the control group (in which the score increased by 1%) (P<0.001 for the between-group differences). Moreover, the peak oxygen consumption improved more in the diet-exercise group than in the diet group or the exercise group (increases of 17% vs. 10% and 8%, respectively; P<0.001); the score on the Functional Status Questionnaire, in which higher scores indicate better physical function, increased more in the diet-exercise group than in the diet group (increase of 10% vs. 4%, P<0.001). Body weight decreased by 10% in the diet group and by 9% in the diet-exercise group, but did not decrease in the exercise group or the control group (P<0.001). Lean body mass and bone mineral density at the hip decreased less in the diet-exercise group than in the diet group (reductions of 3% and 1%, respectively, in the diet-exercise group vs. reductions of 5% and 3%, respectively, in the diet group; P<0.05 for both comparisons). Strength, balance, and gait improved consistently in the diet-exercise group (P<0.05 for all comparisons). Adverse events included a small number of exercise-associated musculoskeletal injuries.
Conclusions: These findings suggest that a combination of weight loss and exercise provides greater improvement in physical function than either intervention alone. (Funded by the National Institutes of Health; ClinicalTrials.gov number, NCT00146107.).
Conflict of interest statement
No potential conflict of interest relevant to this article was reported.
Figures
Comment in
-
Weight loss and exercise in obese older adults.N Engl J Med. 2011 Jun 23;364(25):2467; author reply 2467-8. doi: 10.1056/NEJMc1104830. N Engl J Med. 2011. PMID: 21696316 No abstract available.
-
Weight loss and exercise in obese older adults.N Engl J Med. 2011 Jun 23;364(25):2466-7; author reply 2467-8. doi: 10.1056/NEJMc1104830. N Engl J Med. 2011. PMID: 21696317 No abstract available.
-
Diet and exercise for frail obese older adults.Clin J Sport Med. 2012 Sep;22(5):452-3. doi: 10.1097/JSM.0b013e31826a0955. Clin J Sport Med. 2012. PMID: 22929047 No abstract available.
References
-
- van Baak MA, Visscher TL. Public health success in recent decades may be in danger if lifestyles of the elderly are neglected. Am J Clin Nutr. 2006;84:1257–8. - PubMed
-
- Villareal DT, Apovian CM, Kushner RF, Klein S. Obesity in older adults: technical review and position statement of the American Society for Nutrition and NAASO, The Obesity Society. Am J Clin Nutr. 2005;82:923–34. - PubMed
-
- Arterburn DE, Crane PK, Sullivan SD. The coming epidemic of obesity in elderly Americans. J Am Geriatr Soc. 2004;52:1907–12. - PubMed
-
- Roubenoff R. Sarcopenic obesity: the confluence of two epidemics. Obes Res. 2004;12:887–8. - PubMed
-
- Mokdad AH, Ford ES, Bowman BA, et al. Prevalence of obesity, diabetes, and obesity-related health risk factors, 2001. JAMA. 2003;289:76–9. - PubMed