

Quantitative pharmacological analysis of antagonist binding kinetics at CRF1 receptors in vitro and in vivo
- PMID: 21449919
- PMCID: PMC3195921
- DOI: 10.1111/j.1476-5381.2011.01390.x
Quantitative pharmacological analysis of antagonist binding kinetics at CRF1 receptors in vitro and in vivo
Abstract
Background and purpose: A series of novel non-peptide corticotropin releasing factor type-1 receptor (CRF(1)) antagonists were found to display varying degrees of insurmountable and non-competitive behaviour in functional in vitro assays. We describe how we attempted to relate this behaviour to ligand receptor-binding kinetics in a quantitative manner and how this resulted in the development and implementation of an efficient pharmacological screening method based on principles described by Motulsky and Mahan.
Experimental approach: A non-equilibrium binding kinetic assay was developed to determine the receptor binding kinetics of non-peptide CRF(1) antagonists. Nonlinear, mixed-effects modelling was used to obtain estimates of the compounds association and dissociation rates. We present an integrated pharmacokinetic-pharmacodynamic (PKPD) approach, whereby the time course of in vivo CRF(1) receptor binding of novel compounds can be predicted on the basis of in vitro assays.
Key results: The non-competitive antagonist behaviour appeared to be correlated to the CRF(1) receptor off-rate kinetics. The integrated PKPD model suggested that, at least in a qualitative manner, the in vitro assay can be used to triage and select compounds for further in vivo investigations.
Conclusions and implications: This study provides evidence for a link between ligand offset kinetics and insurmountable/non-competitive antagonism at the CRF(1) receptor. The exact molecular pharmacological nature of this association remains to be determined. In addition, we have developed a quantitative framework to study and integrate in vitro and in vivo receptor binding kinetic behaviour of CRF(1) receptor antagonists in an efficient manner in a drug discovery setting.
© 2011 PFIZER Limited. British Journal of Pharmacology © 2011 The British Pharmacological Society.
Figures


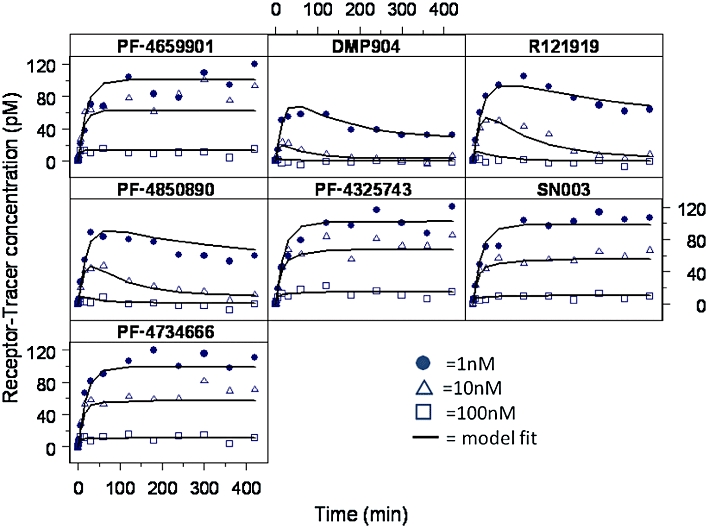

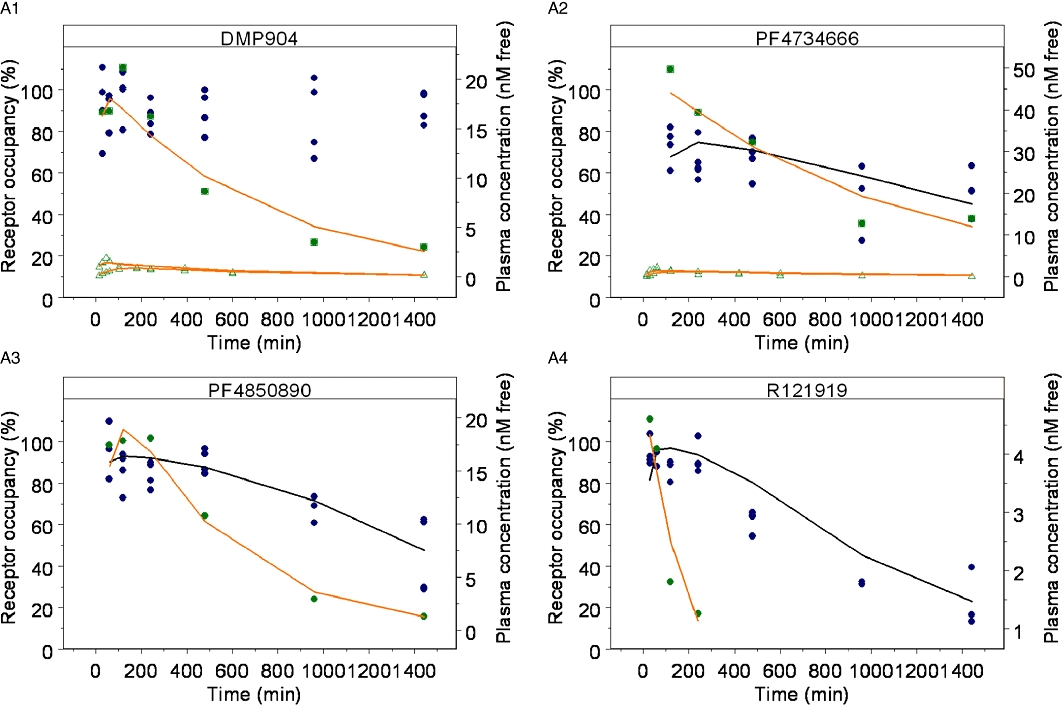
 ) and model fit (solid black line), and plasma concentration from receptor occupancy study (
 ), or satellite oral pharmacokinetic study (
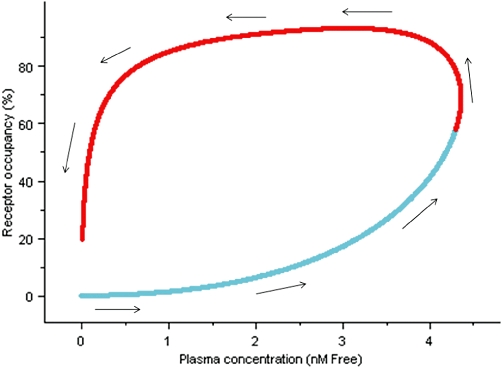
 ) and model fit (solid orange line) versus time relationships. Since DMP904 did not display a significant decay in receptor occupancy during the time course of the experiment, no attempt was made to fit a PKPD model to the data for this ligand. (B) In vivo concentration versus receptor occupancy relationship: (
 ) = observed data, solid red line = model fit. Since DMP904 did not display a significant decay in receptor occupancy during the time course of the experiment, no attempt was made to fit a PKPD model to the data for this ligand.
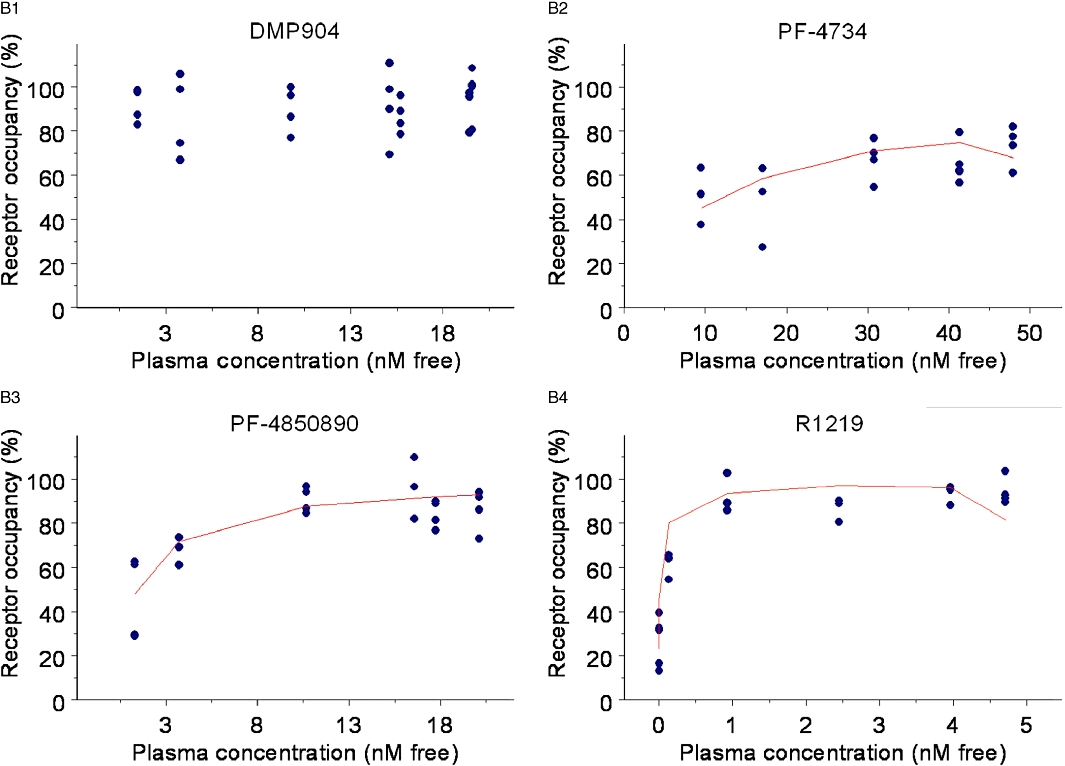 ) and model fit (solid black line), and plasma concentration from receptor occupancy study (), or satellite oral pharmacokinetic study () and model fit (solid orange line) versus time relationships. Since DMP904 did not display a significant decay in receptor occupancy during the time course of the experiment, no attempt was made to fit a PKPD model to the data for this ligand. (B) In vivo concentration versus receptor occupancy relationship: () = observed data, solid red line = model fit. Since DMP904 did not display a significant decay in receptor occupancy during the time course of the experiment, no attempt was made to fit a PKPD model to the data for this ligand.
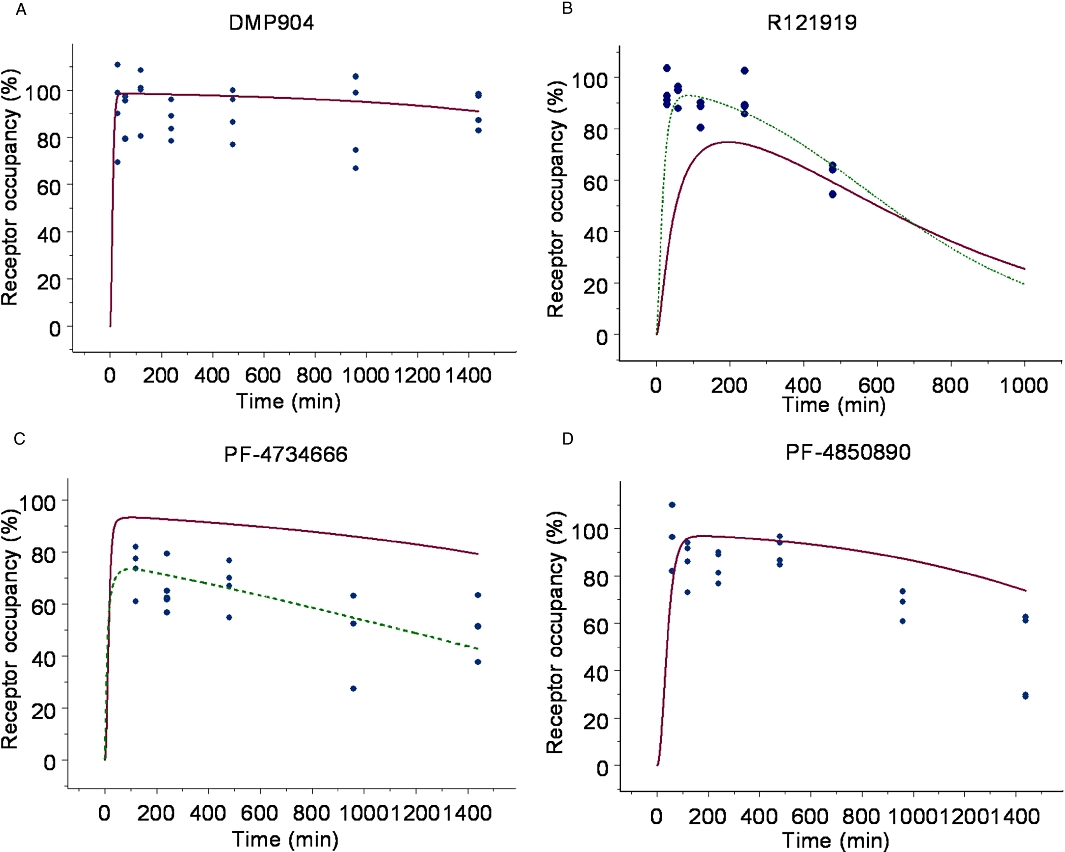
 ). (A) DMP904, (B) R121919, (C) PF-4734666, (D) PF-4850890.

References
-
- Bradford MM. A rapid and sensitive method for the quantitation of microgram quantities of protein utilizing the principle of protein-dye binding. Anal Biochem. 1976;72:248–254. - PubMed
-
- Chalmers DT, Lovenberg TW, Grigoriadis DE, Behan DP, De Souza EB. Corticotrophin-releasing factor receptors: from molecular biology to drug design. Trends Pharmacol Sci. 1996;17:166–172. - PubMed
MeSH terms
Substances
LinkOut - more resources
Full Text Sources
Other Literature Sources
