Comparative Study
. 2011 Mar 30;31(13):4811-20.
doi: 10.1523/JNEUROSCI.1452-10.2011.

The known unknowns: neural representation of second-order uncertainty, and ambiguity

Affiliations
Comparative Study

The known unknowns: neural representation of second-order uncertainty, and ambiguity

Dominik R Bach et al. J Neurosci. .

Abstract

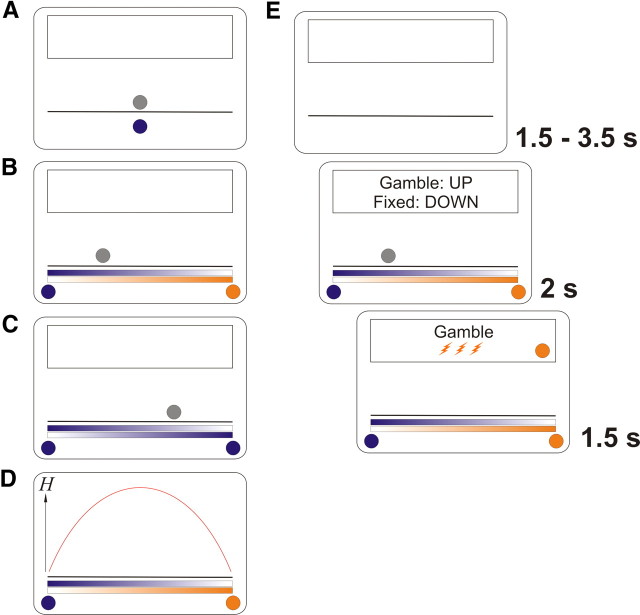
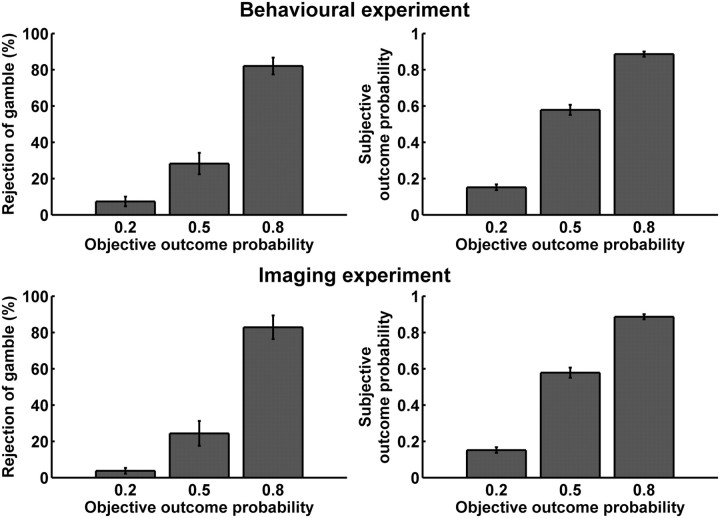
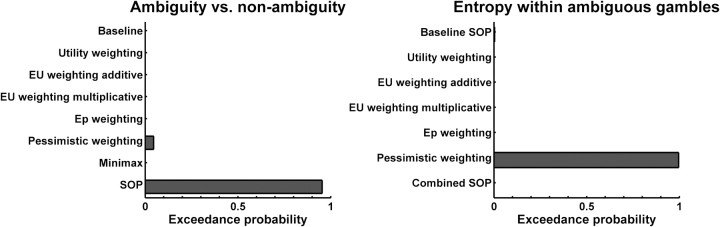
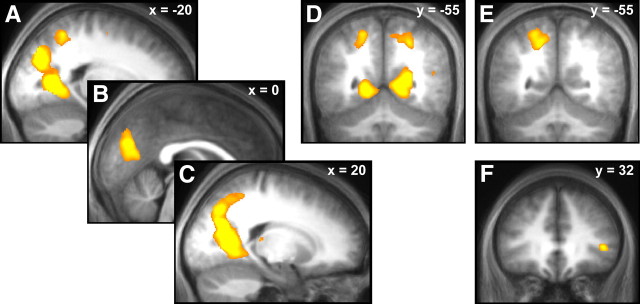
Predictions provided by action-outcome probabilities entail a degree of (first-order) uncertainty. However, these probabilities themselves can be imprecise and embody second-order uncertainty. Tracking second-order uncertainty is important for optimal decision making and reinforcement learning. Previous functional magnetic resonance imaging investigations of second-order uncertainty in humans have drawn on an economic concept of ambiguity, where action-outcome associations in a gamble are either known (unambiguous) or completely unknown (ambiguous). Here, we relaxed the constraints associated with a purely categorical concept of ambiguity and varied the second-order uncertainty of gambles continuously, quantified as entropy over second-order probabilities. We show that second-order uncertainty influences decisions in a pessimistic way by biasing second-order probabilities, and that second-order uncertainty is negatively correlated with posterior cingulate cortex activity. The category of ambiguous (compared with nonambiguous) gambles also biased choice in a similar direction, but was associated with distinct activation of a posterior parietal cortical area; an activation that we show reflects a different computational mechanism. Our findings indicate that behavioral and neural responses to second-order uncertainty are distinct from those associated with ambiguity and may call for a reappraisal of previous data.


Figures

Figure 1.
Figure 1.
Experimental setup. A, Preceding learning task. In each of 144 trials, participants saw a colored ball. Each of three ball colors represented a gamble (framed as “lottery ticket”) with a different first-order probability (0.2, 0.5, 0.8) of getting three electric shocks, or nothing. Participants chose between that gamble and one certain electric shock of the same magnitude. A fading gray silhouette directly above it indicated the time that was allowed for the decision. B, Experiment proper. On each of 276 ambiguous trials, two colored balls appeared, indicating two possible first-order probabilities. It was explained that these balls represented two bowling ball players, one of which would play his ball that would be shown as a silhouette. Thus, the closer the silhouette appeared to one of the two balls, the more likely it was to represent this ball. Again, a decision had to be made between the gamble and one certain shock. C, In 84 additional nonambiguous trials, the two balls had the same color. The position of the gray silhouette is uninformative in this case. D, Second-order uncertainty, quantified as Shannon entropy H of the second-order probabilities of which conditional first-order probability would be realized, given the silhouette position. It can be seen that this quantity is highest in the middle between the two balls. E, Timeline. After a variable intertrial interval, the gamble was presented, together with an indication of which key to press (this was held constant within participants and varied between). While the silhouette faded out, a decision had to be made within 1.5 s (behavioral experiment), or 2 s (imaging experiment). The choice, the ball that was being played, and the ultimate outcome, were then shown in the feedback box above the bowling ball lane.
Figure 2.
Figure 2.
In a preceding learning task consisting of 144 trials, participants learned the outcome probabilities of the three colored balls. Choices for the last 24 balanced trials of this part are shown on the left. After the experiment proper, participants were asked for explicit estimates of the outcome probabilities of the three colored balls, as shown on the right. All results are mean ± SE for participants that were included into the analysis (behavioral experiment: n = 24, imaging experiment, n = 20). Participants whose choice proportions and subjective probability estimates did not monotonically vary with outcome probability were excluded from scanning/analysis.
Figure 3.
Figure 3.
Exceedance probabilities (i.e., probability that a given model is more frequent in the population than the other models) of a random-effects Bayesian model comparison. Results are shown for AIC; see Results for BIC. Exceedance probabilities of the winning models are decisive (p > 0.95). The models are detailed in Table 1 and in the supplemental material (available at www.jneurosci.org).
Figure 4.
Figure 4.
A–D, BOLD responses to low second-order uncertainty (i.e., Shannon entropy of second-order probabilities) within ambiguous trials. E, Different responses were found for the contrast ambiguity vs nonambiguity (note that responses in the posterior parietal cortex, D and E, are high for ambiguity where entropy is higher than in nonambiguity, but also high for low entropy within ambiguous trials, suggesting that responses to ambiguity are not driven by entropy). F, Responses to ambiguity vs nonambiguity in right inferior frontal gyrus covaries with ambiguity aversion on a between-subject level. All contrasts are overlaid on an average normalized T1 image from the whole sample and are in neurological convention. Responses in AE survive whole brain correction for familywise error at a cluster-level threshold of p < 0.05 and a voxel-level threshold of p < 0.001; responses in F are small volume corrected for familywise error at a voxel-level threshold of p < 0.05.

References

    1. Akaike H. Information measures and model selection. Bull Int Stat Inst. 1973;20:277–290.
    1. Andersson JL, Hutton C, Ashburner J, Turner R, Friston K. Modeling geometric deformations in EPI time series. Neuroimage. 2001;13:903–919. - PubMed
    1. Bach DR, Seymour B, Dolan RJ. Neural activity associated with the passive prediction of ambiguity and risk for aversive events. J Neurosci. 2009;29:1648–1656. - PMC - PubMed
    1. Ballard K, Knutson B. Dissociable neural representations of future reward magnitude and delay during temporal discounting. Neuroimage. 2009;45:143–150. - PMC - PubMed
    1. Becker SW, Brownson FO. What price ambiguity? Or the role of ambiguity in decision making. J Polit Econ. 1964;72:62–73.

Publication types