Comparative Study
. 2011 Mar 30;31(13):4878-85.
doi: 10.1523/JNEUROSCI.3658-10.2011.

Basal ganglia neurons dynamically facilitate exploration during associative learning

Affiliations
Comparative Study

Basal ganglia neurons dynamically facilitate exploration during associative learning

Sameer A Sheth et al. J Neurosci. .

Abstract

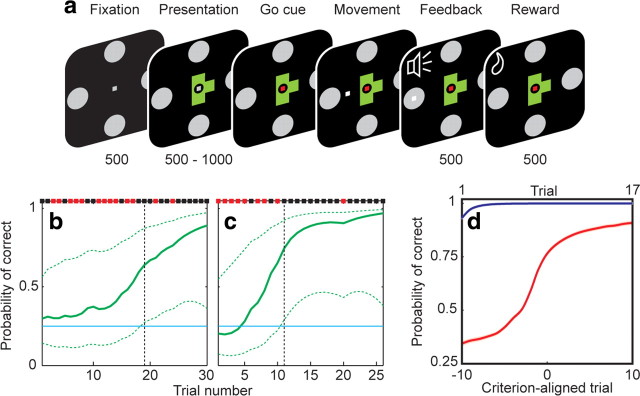
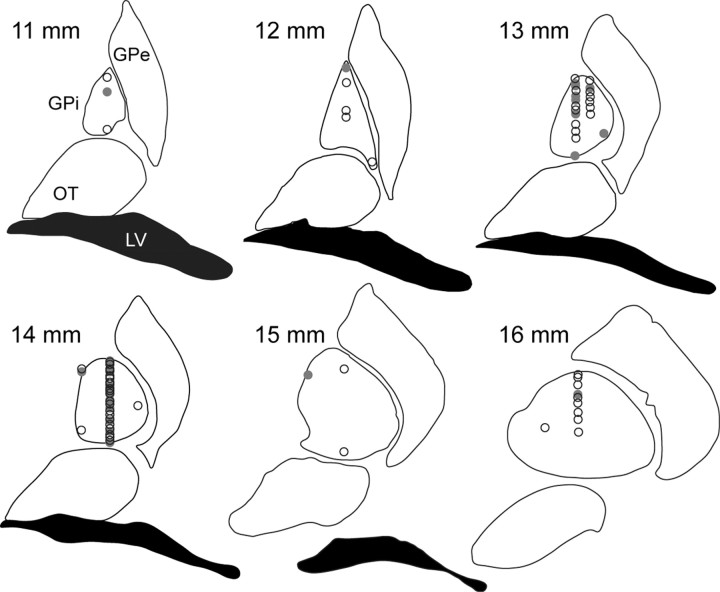
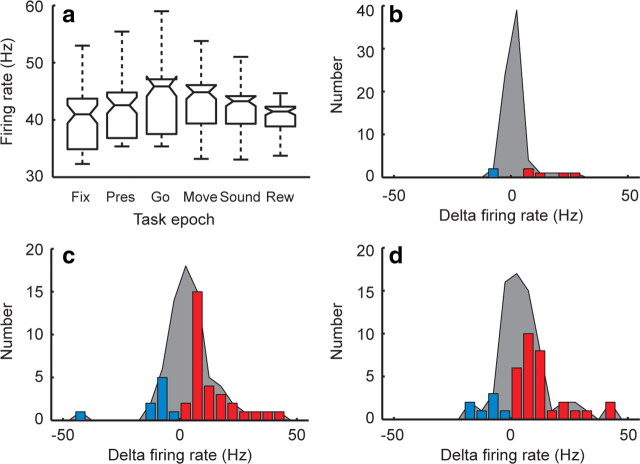
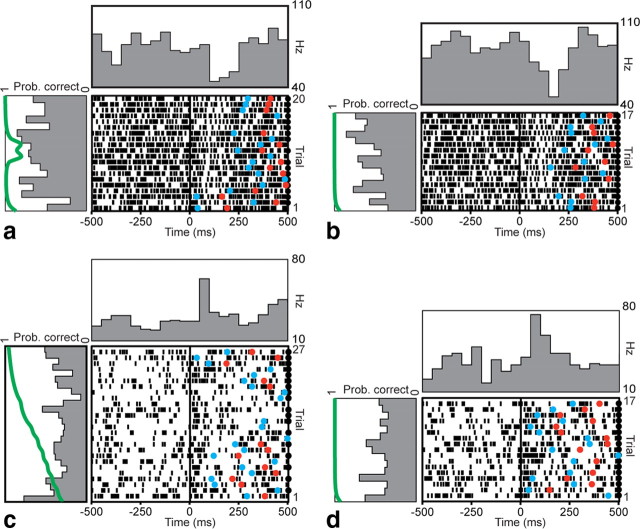
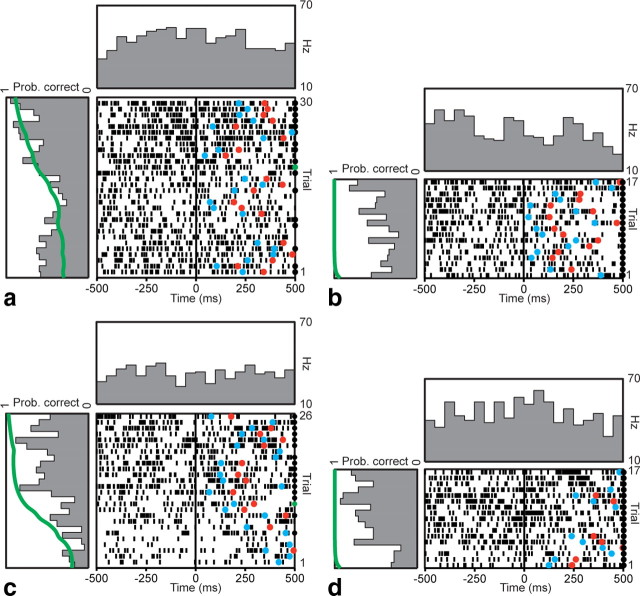
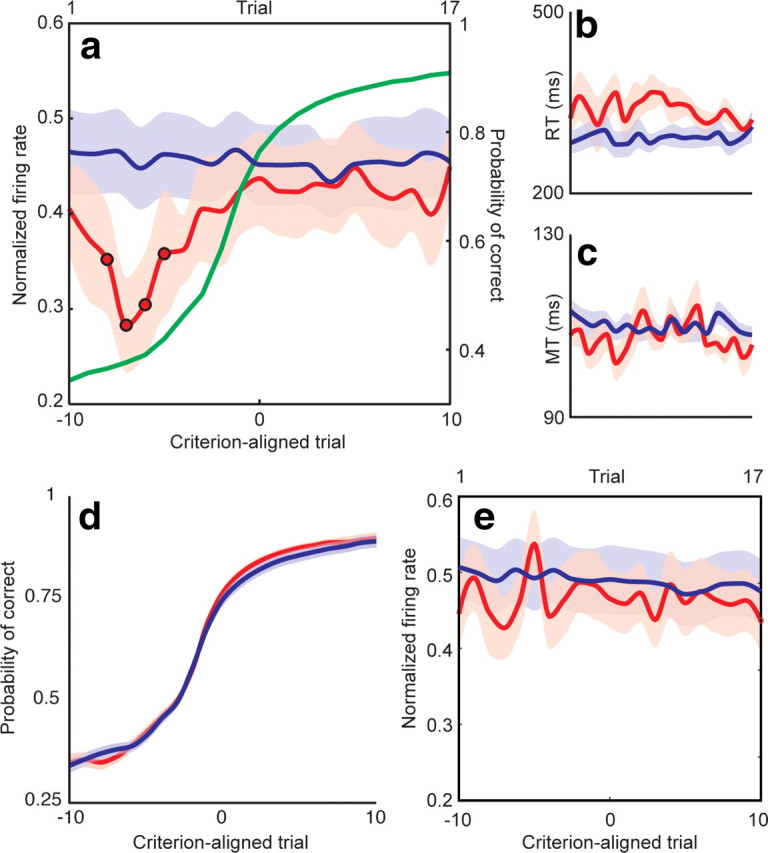
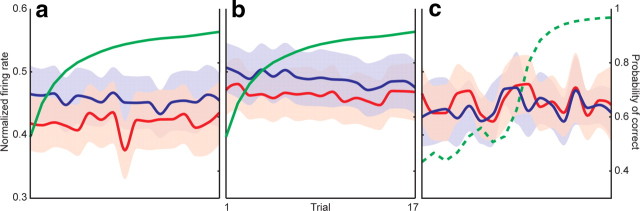
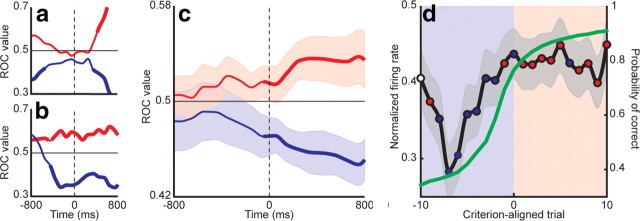
The basal ganglia (BG) appear to play a prominent role in associative learning, the process of pairing external stimuli with rewarding responses. Accumulating evidence suggests that the contributions of various BG components may be described within a reinforcement learning model, in which a broad repertoire of possible responses to environmental stimuli are evaluated before the most profitable one is chosen. The striatum receives diverse cortical inputs, providing a rich source of contextual information about environmental cues. It also receives projections from midbrain dopaminergic neurons, whose phasic activity reflects a reward prediction error signal. These coincident information streams are well suited for evaluating responses and biasing future actions toward the most profitable response. Still lacking in this model is a mechanistic description of how initial response variability is generated. To investigate this question, we recorded the activity of single neurons in the globus pallidus internus (GPi), the primary BG output nucleus, in nonhuman primates (Macaca mulatta) performing a motor associative learning task. A subset (29%) of GPi neurons showed learning-related effects, decreasing firing during the early stages of learning, then returning to higher baseline rates as associations were mastered. On a trial-by-trial basis, lower firing rates predicted exploratory behavior, whereas higher rates predicted an exploitive response. These results suggest that, during associative learning, BG output is initially permissive, allowing exploration of a variety of responses. Once a profitable response is identified, increased GPi activity suppresses alternative responses, sharpening the response profile and encouraging exploitation of the profitable learned behavior.


Figures

Figure 1.
Figure 1.
Behavioral task and performance. a, The sequence of task epochs and their duration in milliseconds is shown for each representative screen. A fixation spot and the four targets appeared for 500 ms, followed by presentation of an object. After a variable delay, the go cue was indicated by a color change in the fixation spot, allowing joystick movement. Once the target was reached and held for 50 ms, a high or low tone indicated correct or incorrect response, respectively, and correct responses were rewarded with a drop of water. Fixation within a 1° window was required until target acquisition. b, c, Behavior during example learning blocks. Binary results (black, correct; red, incorrect) are shown along the top. The estimated learning curve is shown in green, with 99% confidence intervals indicated by the dashed lines. The criterion trial (vertical black dashed line) was defined as the point at which the lower 99% confidence interval surpassed chance (25%, horizontal blue line). These two learning blocks are the same as those depicted in Figure 5, a and c. d, Population performance during familiar object (blue) and novel object (red) trials over learning, averaged across all learning blocks. Novel object trials are aligned to the criterion trial (lower x-axis labels) to allow for comparison across blocks regardless of learning rate. Familiar object trials are ordinally numbered (upper x-axis labels), as a criterion learning trial does not apply. Performance indicated mastery of familiar objects, and a gradually improving learning curve for novel objects. SEs are indicated by shading but are too small to be visible.
Figure 2.
Figure 2.
Location of GPi recording sites. Recording site location was determined by confirmation between stereotactic coordinates and physiological characteristics of deep nuclei and white matter boundaries. Coronal sections anterior to the interaural plane (noted in millimeters) from a standard atlas are diagramed with recording site locations. Sites with learning-related neurons are indicated with a filled circle, and learning-unrelated neurons with an open circle. GPe, globus pallidus externus; OT, optic tract; LV, lateral ventricle.
Figure 3.
Figure 3.
Population task responsiveness. a, Box plot of population firing rates across the six task epochs: fixation (Fix), presentation (Pres), go cue (Go), movement (Move), feedback sound (Sound), and reward (Rew). The central line in each box represents the median, the box edges the 25% and 75% quartiles, and the whiskers 2.7 SDs (representing ∼99.3% of the data). b–d, Distribution of changes in firing rate (with respect to fixation) at the presentation, go cue, and movement epochs, respectively. The shaded region represents any change in firing rate relative to fixation, and the colored bars represent statistically significant increases (red) or decreases (blue).
Figure 4.
Figure 4.
Example firing pattern of two learning-unrelated neurons. Rasters and peristimulus time histograms for sequential trials (bottom to top) aligned to the go cue (t = 0) are shown for two example neurons, over the course of a single learning block. a, b, This neuron decreased firing near the go cue when presented with both novel (a) and concurrently presented familiar (b) objects. Mean fixation firing rate during novel object trials was 60 Hz. c, d, This neuron increased firing near the go cue during both novel (c) and familiar (d) object trials. Mean fixation firing rate during novel object trials was 29 Hz. These changes are evident in the histograms in the panel above the raster. The histograms in the panels to the left of the rasters show changes in peri-go cue activity over the course of the learning block, averaged within a 500 ms window centered on the go cue. The green line in the left panel depicts the learning curve for that block (Prob. correct). Neither neuron demonstrated any learning-related modulation over the course of the block. Correct trials are indicated by black circles on the right edge of the raster. Reaction times and movement times in each trial are indicated by blue and red circles, respectively.
Figure 5.
Figure 5.
Example firing patterns of two learning-related neurons. Rasters and peristimulus time histograms aligned to the go cue are shown for two neurons. a, b, Example firing pattern of a learning-related neuron during presentation of a novel object (a) and a concurrently presented familiar object (b). Correct trials are indicated by a black circle on the right edge of the raster. The trial at which learning criterion was achieved is indicated with a green circle. This neuron decreased its firing during novel object trials near the middle of the learning block, but exhibited no such pattern during familiar object trials. Learning criterion occurred at trial number 19. Mean fixation firing rate during novel object trials was 20 Hz. c, d, Example firing pattern of a second learning-related neuron during novel (c) and familiar (d) object trials. This neuron decreased firing early in the block during novel object trials. Learning criterion occurred at trial number 11. Mean fixation firing rate was 34 Hz. Histograms were calculated as in Figure 4. Behavioral curves for a and c are the same as those depicted with explanation in Figure 1, b and c.
Figure 6.
Figure 6.
GPi firing encodes a facilitation window. a, Normalized firing rate for novel (red) object trials as a function of criterion-aligned trial number for the subset of learning-related neurons. Familiar object trials (blue) are shown as a function of ordinal trial number (top x-axis), as alignment to criterion was not applicable. The learning curve (right y-axis) is shown in green. There was a significant (p < 0.05, circles) decrease in firing rate during novel object trials early in learning. Because pallidothalamic projections are inhibitory, this decrease encodes a facilitation window that can promote particular downstream motor programs. Reaction times (RT; b) and movement times (MT; c) for novel and familiar object trials showed no difference between precriterion and postcriterion values. x-Axis values for b and c are identical to a. d, Learning curves were identical between sessions during which learning-related neurons (red) and learning-unrelated neurons (blue) were recorded. e, Population activity of the 52 learning-unrelated neurons did not exhibit a similar decrease in GPi firing. As in a, novel object trials are depicted in red, and familiar object trials in blue. Shading indicates SEM.
Figure 7.
Figure 7.
The facilitation window is not an effect of stimulus novelty or reward schedule. a, The same firing rates of learning-related neurons for novel (red) and familiar (blue) object trials as depicted in Figure 6a, aligned to ordinal trial number, starting at the first correct response, rather than to criterion. The learning curve is shown in green. Alignment to ordinal trial number removed the decrease in GPi firing, suggesting that this effect was specific to learning, rather than simply to stimulus novelty. b, Alignment to first correct response of the learning-unrelated neurons (depicted in Fig. 6e), again demonstrating no facilitation window. c, GPi firing during a control task in which responses were guided by a color change in the target, such that the movements and reward schedules matched those of interleaved blocks of the normal learning task (see Materials and Methods). The dashed green line indicates the learning curve from the neighboring block of the regular task, as the control block itself had guided cues precluding learning. Removal of the necessity to actively learn the associations again eliminated the decrease in firing. Shaded regions indicate SEM. All axes share the same labels and ranges.
Figure 8.
Figure 8.
GPi firing predicts a behavioral shift from exploration to exploitation. ROC discrimination values were calculated for exploration (blue) and exploitation (red) hypotheses in a sliding window 400 ms wide stepped in 100 ms increments, centered on the go cue. Discrimination values for two example neurons are shown in a and b. Thick lines represent significant differences from chance (0.5). Exploration tended to be associated with lower firing rates and exploitation with higher firing rates. c, Population ROC discrimination values for the subpopulation of learning-related neurons. The values for the exploration (blue) and exploitation (red) hypotheses diverged near the time of the go cue. Significant differences between the two are denoted by a thick line. Shaded regions indicate SEM. Lower values for the exploration model indicate that lower firing rates predicted exploratory behavior, whereas higher values for the exploitation model indicate that higher firing rates predicted exploitive behavior. d, To relate these ROC findings to the learning process, discrimination values were calculated as a function of trial number and compared with the actual average firing rate (Fig. 6a). For each trial, blue circles indicate that the firing rate predicted exploratory behavior and red circles indicate that the firing rate predicted exploitive behavior. White circles indicate trials in which the ROCs were not significantly different from chance. Starting eight trials before criterion, precriterion trials were characterized by exploratory behavior (blue shaded region). This pattern shifted around the time of criterion, such that the majority of postcriterion trials demonstrated exploitive behavior (red shaded region).

Similar articles

Cited by

References

    1. Alexander GE, Crutcher MD. Functional architecture of basal ganglia circuits: neural substrates of parallel processing. Trends Neurosci. 1990;13:266–271. - PubMed
    1. Andalman AS, Fee MS. A basal ganglia-forebrain circuit in the songbird biases motor output to avoid vocal errors. Proc Natl Acad Sci U S A. 2009;106:12518–12523. - PMC - PubMed
    1. Barnes TD, Kubota Y, Hu D, Jin DZ, Graybiel AM. Activity of striatal neurons reflects dynamic encoding and recoding of procedural memories. Nature. 2005;437:1158–1161. - PubMed
    1. Brasted PJ, Wise SP. Comparison of learning-related neuronal activity in the dorsal premotor cortex and striatum. Eur J Neurosci. 2004;19:721–740. - PubMed
    1. Britten KH, Newsome WT, Shadlen MN, Celebrini S, Movshon JA. A relationship between behavioral choice and the visual responses of neurons in macaque MT. Vis Neurosci. 1996;13:87–100. - PubMed

Publication types

LinkOut - more resources