

Neural computations governing spatiotemporal pooling of visual motion signals in humans
- PMID: 21451030
- PMCID: PMC3461496
- DOI: 10.1523/JNEUROSCI.6185-10.2011
Neural computations governing spatiotemporal pooling of visual motion signals in humans
Abstract
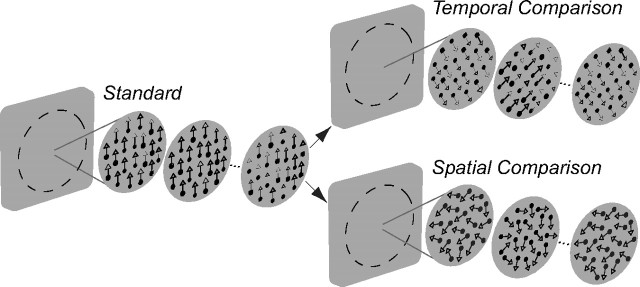
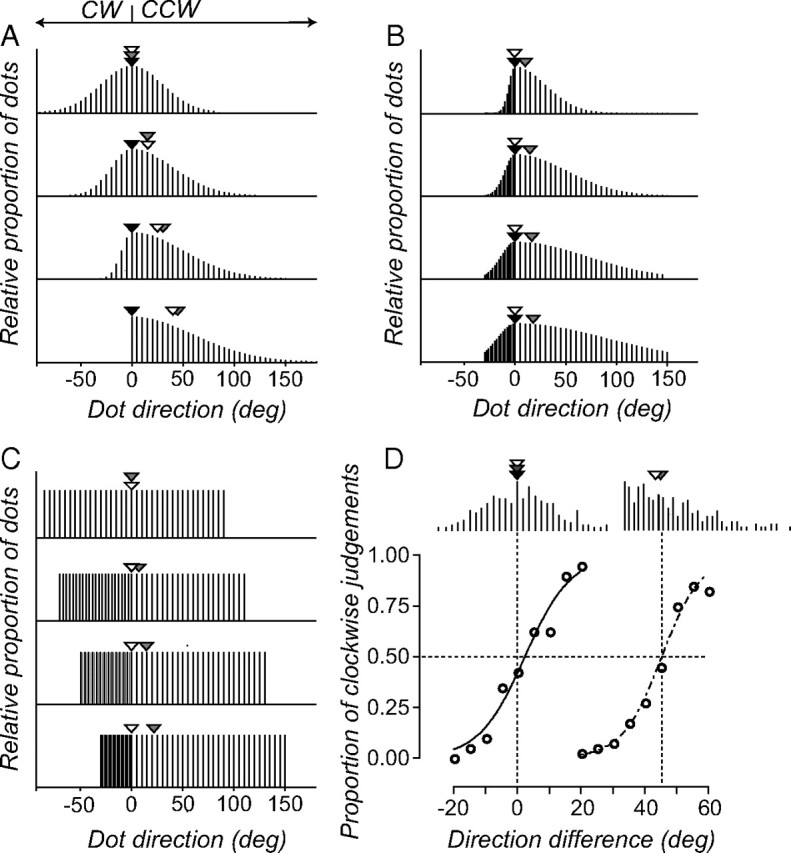
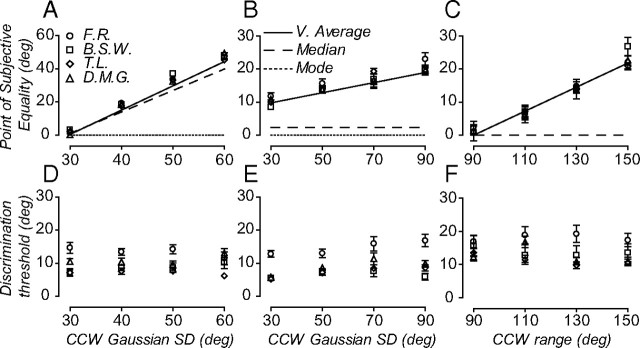
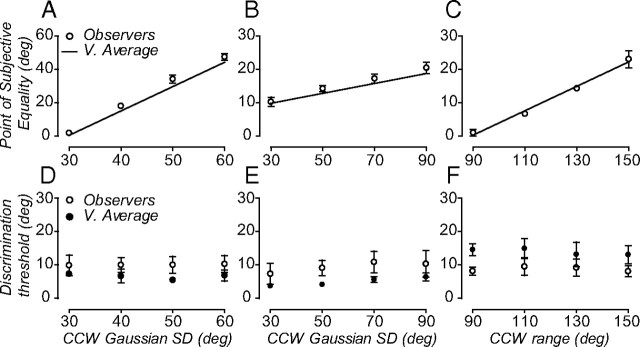
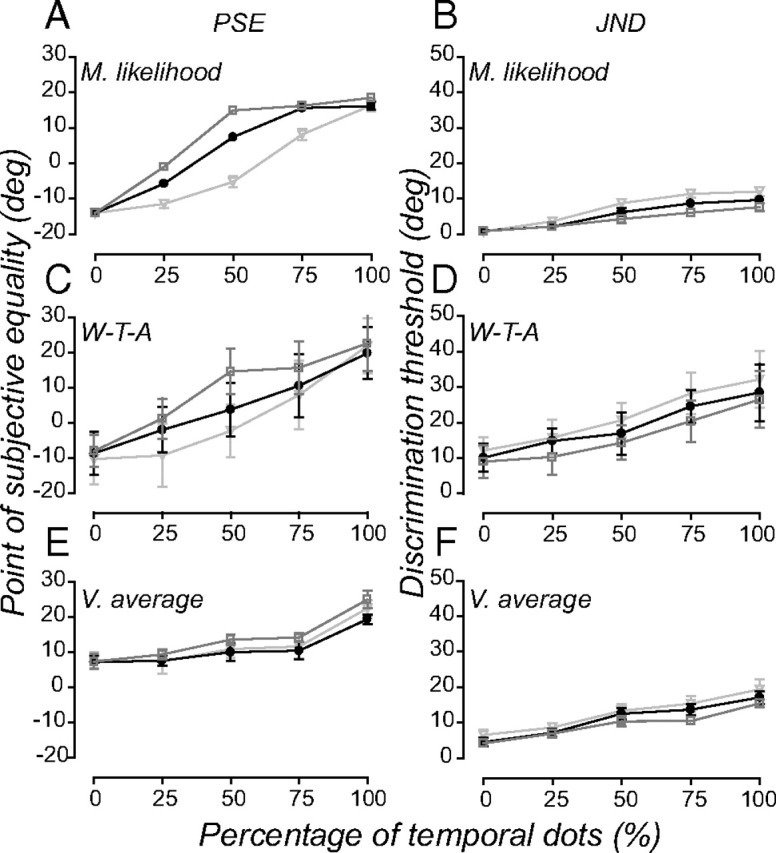
The brain estimates visual motion by decoding the responses of populations of neurons. Extracting unbiased motion estimates from early visual cortical neurons is challenging because each neuron contributes an ambiguous (local) representation of the visual environment and inherently variable neural response. To mitigate these sources of noise, the brain can pool across large populations of neurons, pool the response of each neuron over time, or a combination of the two. Recent psychophysical and physiological work points to a flexible motion pooling system that arrives at different computational solutions over time and for different stimuli. Here we ask whether a single, likelihood-based computation can accommodate the flexible nature of spatiotemporal motion pooling in humans. We examined the contribution of different computations to human observers' performance on two global visual motion discriminations tasks, one requiring the combination of motion directions over time and another requiring their combination in different relative proportions over space and time. Observers' perceived direction of global motion was accurately predicted by a vector average readout of direction signals accumulated over time and a maximum likelihood readout of direction signals combined over space, consistent with the notion of a flexible motion pooling system that uses different computations over space and time. Additional simulations of observers' performance with a population decoding model revealed a more parsimonious solution: flexible spatiotemporal pooling could be accommodated by a single computation that optimally pools motion signals across a population of neurons that accumulate local motion signals on their receptive fields at a fixed rate over time.
Figures
Similar articles
-
Integration of sensory evidence in motion discrimination.J Vis. 2007 Sep 20;7(12):7.1-7. doi: 10.1167/7.12.7. J Vis. 2007. PMID: 17997649 Free PMC article.
-
Adaptive pooling of visual motion signals by the human visual system revealed with a novel multi-element stimulus.J Vis. 2009 Mar 13;9(3):4.1-25. doi: 10.1167/9.3.4. J Vis. 2009. PMID: 19757943
-
Mechanisms for Rapid Adaptive Control of Motion Processing in Macaque Visual Cortex.J Neurosci. 2015 Jul 15;35(28):10268-80. doi: 10.1523/JNEUROSCI.1418-11.2015. J Neurosci. 2015. PMID: 26180202 Free PMC article.
-
Cortical pooling algorithms for judging global motion direction.Proc Natl Acad Sci U S A. 2007 Feb 27;104(9):3532-7. doi: 10.1073/pnas.0611288104. Epub 2007 Feb 20. Proc Natl Acad Sci U S A. 2007. PMID: 17360678 Free PMC article.
-
Normalization as a canonical neural computation.Nat Rev Neurosci. 2011 Nov 23;13(1):51-62. doi: 10.1038/nrn3136. Nat Rev Neurosci. 2011. PMID: 22108672 Free PMC article. Review.
Cited by
-
Criterion-free measurement of motion transparency perception at different speeds.J Vis. 2018 Apr 1;18(4):5. doi: 10.1167/18.4.5. J Vis. 2018. PMID: 29614154 Free PMC article.
-
Age-related changes in fine motion direction discriminations.Exp Brain Res. 2013 Jul;228(3):257-78. doi: 10.1007/s00221-013-3559-4. Epub 2013 May 26. Exp Brain Res. 2013. PMID: 23708801
-
Shared sensory estimates for human motion perception and pursuit eye movements.J Neurosci. 2015 Jun 3;35(22):8515-30. doi: 10.1523/JNEUROSCI.4320-14.2015. J Neurosci. 2015. PMID: 26041919 Free PMC article.
-
Integration of allocentric and egocentric visual information in a convolutional/multilayer perceptron network model of goal-directed gaze shifts.Cereb Cortex Commun. 2022 Jul 8;3(3):tgac026. doi: 10.1093/texcom/tgac026. eCollection 2022. Cereb Cortex Commun. 2022. PMID: 35909704 Free PMC article.
-
Visual motion integration is mediated by directional ambiguities in local motion signals.Front Comput Neurosci. 2013 Nov 18;7:167. doi: 10.3389/fncom.2013.00167. eCollection 2013. Front Comput Neurosci. 2013. PMID: 24302910 Free PMC article.
References
-
- Adelson EH, Bergen JR. Spatiotemporal energy models for the perception of motion. J Opt Soc Am A. 1985;2:284–299. - PubMed
-
- Alais D, Burr D. The ventriloquist effect results from near-optimal bimodal integration. Curr Biol. 2004;14:257–262. - PubMed
-
- Albrecht DG, Geisler WS. Motion selectivity and the contrast-response function of simple cells in the visual cortex. Vis Neurosci. 1991;7:531–546. - PubMed
-
- Albright TD. Direction and orientation selectivity of neurons in visual area MT of the macaque. J Neurophysiol. 1984;52:1106–1130. - PubMed
-
- Amano K, Edwards M, Badcock DR, Nishida S. Adaptive pooling of visual motion signals by the human visual system revealed with a novel multi-element stimulus. J Vis. 2009;9:1–25. - PubMed
Publication types
MeSH terms
Grants and funding
LinkOut - more resources
Full Text Sources