Comparative Study
. 2011 Mar 30;31(13):5000-12.
doi: 10.1523/JNEUROSCI.5800-10.2011.

An intrinsic neural oscillator in the degenerating mouse retina

Affiliations
Comparative Study

An intrinsic neural oscillator in the degenerating mouse retina

Joanna Borowska et al. J Neurosci. .

Abstract

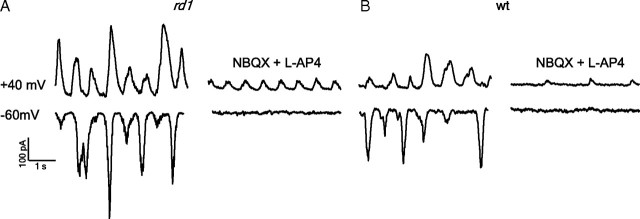
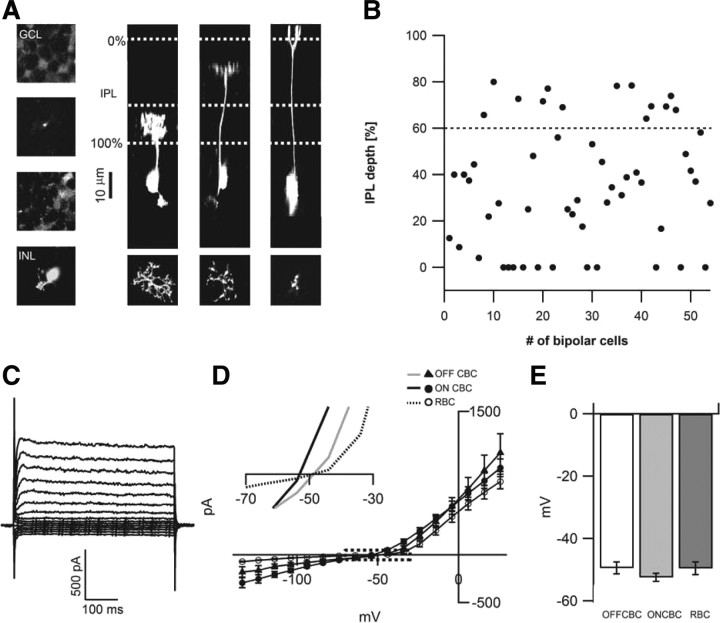
The loss of photoreceptors during retinal degeneration (RD) is known to lead to an increase in basal activity in remnant neural networks. To identify the source of activity, we combined two-photon imaging with patch-clamp techniques to examine the physiological properties of morphologically identified retinal neurons in a mouse model of RD (rd1). Analysis of activity in rd1 ganglion cells revealed sustained oscillatory (∼10 Hz) synaptic activity in ∼30% of all classes of cells. Oscillatory activity persisted after putative inputs from residual photoreceptor, rod bipolar cell, and inhibitory amacrine cell synapses were pharmacologically blocked, suggesting that presynaptic cone bipolar cells were intrinsically active. Examination of presynaptic rd1 ON and OFF bipolar cells indicated that they rested at relatively negative potentials (less than -50 mV). However, in approximately half the cone bipolar cells, low-amplitude membrane oscillation (∼5 mV, ∼10 Hz) were apparent. Such oscillations were also observed in AII amacrine cells. Oscillations in ON cone bipolar and AII amacrine cells exhibited a weak apparent voltage dependence and were resistant to blockade of synaptic receptors, suggesting that, as in wild-type retina, they form an electrically coupled network. In addition, oscillations were insensitive to blockers of voltage-gated Ca(2+) channels (0.5 mm Cd(2+) and 0.5 mm Ni(2+)), ruling out known mechanisms that underlie oscillatory behavior in bipolar cells. Together, these results indicate that an electrically coupled network of ON cone bipolar/AII amacrine cells constitutes an intrinsic oscillator in the rd1 retina that is likely to drive synaptic activity in downstream circuits.


Figures

Figure 1.
Figure 1.
Spontaneous activity in morphologically identified ganglion cells. Ai, Confocal image stacks of ON (left), OFF (middle), and ON/OFF (right) rd1 ganglion cells. Side views of these cells (bottom row) illustrate their dendritic stratification in the IPL. Scale bars, 50 μm. Aii, Spike activity recorded in the ganglion cells shown in Ai. Aiii, Histograms of the average spike rate of individual ON (n = 20), OFF (n = 25), and ON–OFF (n = 13) rd1 ganglion cells. B illustrates the morphology of a wt ON–OFF bistratified ganglion cell (i) and its light-evoked spike activity (horizontal black bar indicates the duration of the light stimulus). Biii, A histogram of the average rate of spontaneous spike activity from 13 wt ON–OFF ganglion cells is plotted. C, Histograms of the interevent intervals from ganglion cells illustrating random (i) and rhythmic patterns (ii) of spike activity. The power spectra of spike activity for the same two cells are overlaid (iii). D, Examples of inhibitory and excitatory currents measured (under voltage clamp at 0 and −60 mV, respectively) in two different ganglion cells (i, ii; note the different timescales). E, Power spectra for sIPSCs and sEPSCs for two cells shown in D.
Figure 2.
Figure 2.
Spontaneous activity within excitatory circuits in the rd1 retina in the absence of inhibitory inputs. A, Examples of sEPSCs (VHOLD of −60 mV) measured from two ganglion cells with differing levels of synaptic activity, before and after the bath application of inhibitory receptor antagonists (50 μm picrotoxin and 5 μm strychnine). B, Example traces depicting sEPSCs at different holding potentials (as indicated on the right of the traces). C, The average peak amplitude (i) and frequency (ii) of sEPSC as function of holding potential (n = 5).
Figure 3.
Figure 3.
Spontaneous output of the rd1 cone bipolar cells. A, Examples of sEPSCs measured at +40 and −60 mV in the presence of inhibitory receptor antagonists (50 μm picrotoxin, 5 μm strychnine, and 100 μm TPMPA) before (left) and after photoreceptor/rod bipolar cells synapses were blocked by the addition of 20 μm l-AP-4 and 5 μm NBQX (right). B, Activity in ganglion cells in wt retina under the same pharmacological conditions as in A.
Figure 4.
Figure 4.
Amacrine cell activity primarily relies on activation of glutamate receptors. A, Example of a Neurobiotin-filled rd1 OFF ganglion cell. B, IPSCs recorded (VHOLD of 0 mV) in the ganglion cell shown in A in control Ringer's solution and in the presence of excitatory blockers (5 μm NBQX and 20 μm l-AP-4). C, Example of a Neurobiotin-filled rd1 amacrine cell in the ganglion cell layer. D, The spontaneous postsynaptic potentials in the cell shown in C, in control Ringer's solution and in the presence of excitatory blockers.
Figure 5.
Figure 5.
ON and OFF rd1 bipolar cells appear morphologically intact and have negative resting potentials. A, Two-photon image stacks through different layers of the rd1 retina after electrophysiological recording from bipolar cells reveals Alexa Fluor 594 labeling of (left, top to bottom) the GCL, the bipolar cell axon, the amacrine cell layer, and the bipolar cell soma. The thickness of the IPL was defined by regions between the GCL (0%) and the amacrine cell layer (100%) as indicated by the horizontal white dotted lines (right). The 60% level that separates the ON and OFF layers is also indicated. In the right three panels, image stacks of bipolar cells filled with Alexa Fluor 594 were rotated 90° to reveal their axonal arborizations in different layers of the IPL. Top views of their terminals are illustrated in the bottom. B, The depth of peak fluorescence of the axon terminal for rd1 bipolar cells in this study are plotted (n = 54). C, Examples of the currents elicited by voltage steps (−100 to +40 mV) from a holding potential of −60 mV in rd1 ON bipolar cell. D, The averaged currents measured at steady state (between 45 and 50 ms after the onset of the voltage step) in rd1 OFF, ON, and rod bipolar cells. The boxed region is shown at a higher magnification to illustrate the average voltages where currents reverse (inset). E, Plot of the average resting potentials in rd1 bipolar cells.
Figure 6.
Figure 6.
Spontaneous activity in rd1 and wt bipolar cells. A, Representative traces depicting oscillatory membrane potential of rd1 ON (top) and OFF (bottom) cone bipolar cells (CBC), recorded in the whole-mount retina. B, Oscillatory activity is absent in wt ON and OFF cone bipolar cells. The responses to spots of light are illustrated in the insets. Calibration: vertical bar, 2 mV for all traces in A and B and 10 mV for insets in B; horizontal bar, 0.5 s for all traces in A and B and 3 s for insets in B. C, Power spectra of the oscillating (black line), non-oscillating rd1 ON cone bipolar cells (gray line) and a wt bipolar cell (gray dotted line). The average frequency (D) and peak amplitude (E) of events are plotted against the depth in the IPL at which bipolar axons terminate. Oscillating rd1 cone bipolar cells are represented as gray circles. Non-oscillating rd1 cone bipolar cells are represented as black diamonds, and rd1 rod bipolar cells (RBC) are represented as light gray squares.
Figure 7.
Figure 7.
Spontaneous oscillations in rd1 AII amacrine cells. A, Spontaneous membrane oscillations in rd1 but not wt (B) AII amacrine cells. The inset in B depicts the light response of the wt AII amacrine cell. Calibration: vertical, 2 mV for A and B and 10 mV for inset in B; horizontal, 0.5 s for A and B and 4 s for inset in B. C, Two-photon image stack (rotated 90°) of an Alexa Fluor 594-filled AII amacrine cell in the whole-mount rd1 retina. D, Power spectra of the membrane potential recorded from an rd1 and wt AII amacrine cell are overlaid.
Figure 8.
Figure 8.
Voltage dependence of spontaneous oscillations in rd1 cone bipolar and AII amacrine cells. A, Spontaneous PSPs in rd1 bipolar cells reverse near ECl, suggesting that these events are mediated by GABA or glycine receptors. B, Spontaneous oscillations in rd1 ON bipolar (B) and AII amacrine (C) cells measured at different potentials, as indicated on the left side. D, The normalized peak amplitude of PSPs (dotted line; n = 4) and oscillatory events measured in rd1 bipolar cells (gray line; n = 14) and AII amacrine cells (black line; n = 3) plotted as a function of membrane potential. CBC, Cone bipolar cell; AC, amacrine cell.
Figure 9.
Figure 9.
Spontaneous oscillations in cone bipolar cells do not rely on chemical transmission or on voltage-gate Ca2+ channels. A,B, PSPs in non-oscillating rd1 bipolar cell in control Ringers's solution (A) or the presence of the excitatory blockers (10 μm NBQX and 20 μm l-AP-4) (B). C–E, Spontaneous oscillations recorded in an ON cone bipolar cell in control Ringer's solution (C)in the presence of a mixture of synaptic blockers (NBQX, l-AP-4, AP-5, strychnine, and picrotoxin) (D), and in the presence of nonselective voltage-gated Ca2+ channel blockers (200 μm Cd2+ and 500 μm Ni2+) (E).
Figure 10.
Figure 10.
Retinal circuit involved in generating spontaneous activity in rd1 retina. ON cone bipolar cells (ON CBCs) and electrically coupled AII amacrine cells (AII ACs) are intrinsically oscillatory (insensitive to synaptic blockers). ON cone bipolar cells excite both ON ganglion cells (ON GC; which use AMPA/KA and NMDA receptors) and inhibitory amacrine cells (AC; which use AMPA/KA receptors). ACs in turn provides reciprocal feedback inhibition to ON CBCs as well as feedforward inhibition to ON GCs (mediated by GABA/glycine receptors). Based on comparison with wt retinal circuitry, this model has been extended to the OFF system. It is hypothesized that AIIs amacrine cells drive the OFF bipolar and ganglion cells through disinhibitory mechanisms. Thus, oscillatory drive to amacrine and ganglion cells arises from intrinsic activity in the AII amacrine/ON cone bipolar cell network and is strongly influenced by inhibitory amacrine cells.

References

    1. Acland GM, Aguirre GD, Ray J, Zhang Q, Aleman TS, Cideciyan AV, Pearce-Kelling SE, Anand V, Zeng Y, Maguire AM, Jacobson SG, Hauswirth WW, Bennett J. Gene therapy restores vision in a canine model of childhood blindness. Nat Genet. 2001;28:92–95. - PubMed
    1. Arai I, Tanaka M, Tachibana M. Active roles of electrically coupled bipolar cell network in the adult retina. J Neurosci. 2010;30:9260–9270. - PMC - PubMed
    1. Awatramani GB, Slaughter MM. Origin of transient and sustained responses in ganglion cells of the retina. J Neurosci. 2000;20:7087–7095. - PMC - PubMed
    1. Awatramani GB, Slaughter MM. Intensity-dependent, rapid activation of presynaptic metabotropic glutamate receptors at a central synapse. J Neurosci. 2001;21:741–749. - PMC - PubMed
    1. Awatramani GB, Boyd JD, Delaney KR, Murphy TH. Effective release rates at single rat Schaffer collateral-CAI synapses during sustained theta-burst activity revealed by optical imaging. J Physiol. 2007;582:583–595. - PMC - PubMed

Publication types

LinkOut - more resources