Comparative Study
. 2011 Mar 30;31(13):5131-44.
doi: 10.1523/JNEUROSCI.6100-10.2011.

Different fear states engage distinct networks within the intercalated cell clusters of the amygdala

Affiliations
Comparative Study

Different fear states engage distinct networks within the intercalated cell clusters of the amygdala

Daniela Busti et al. J Neurosci. .

Abstract

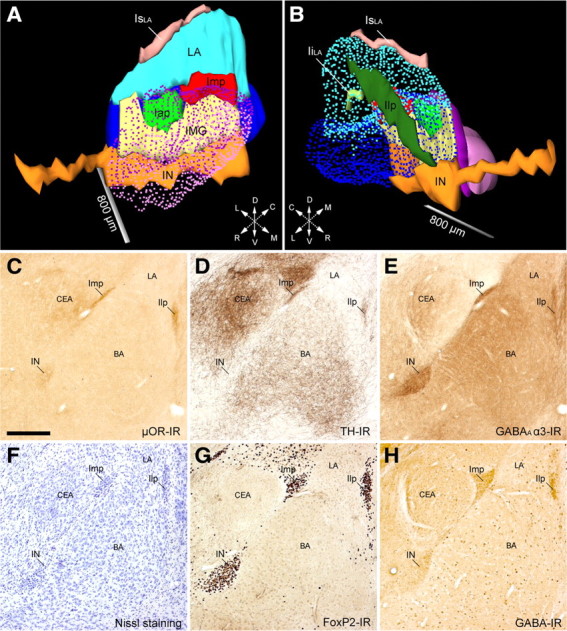
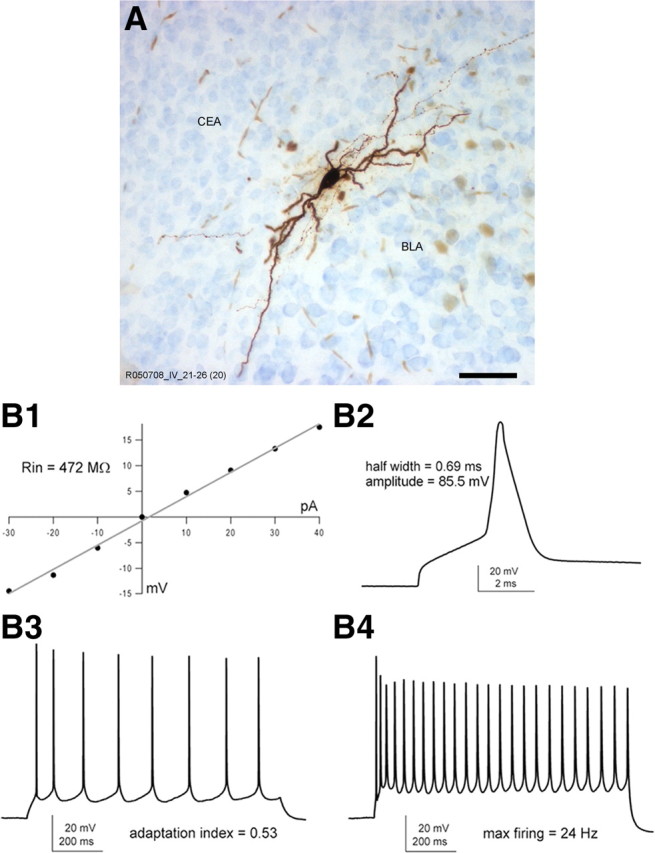
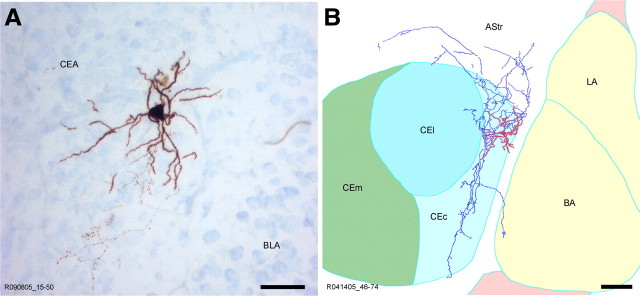
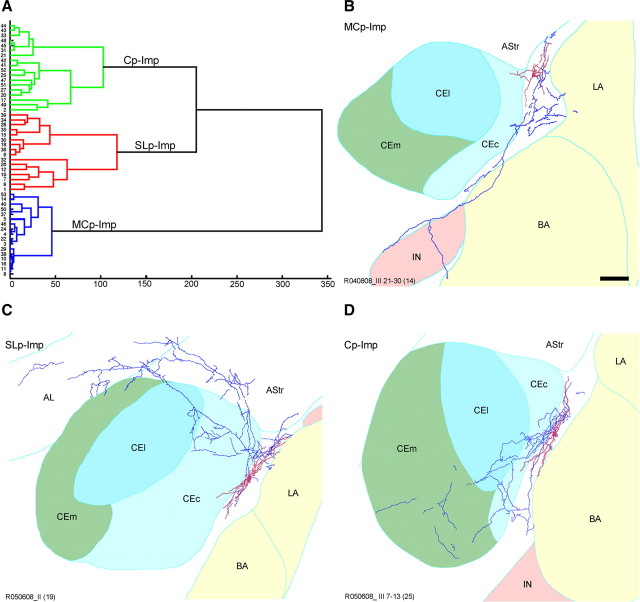
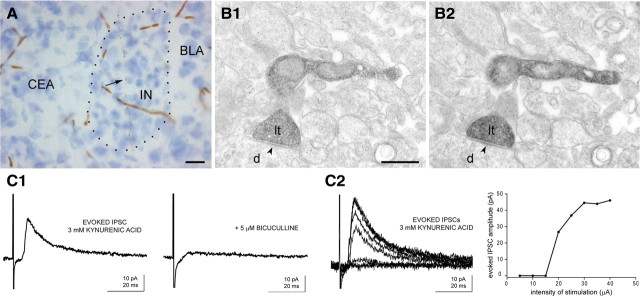
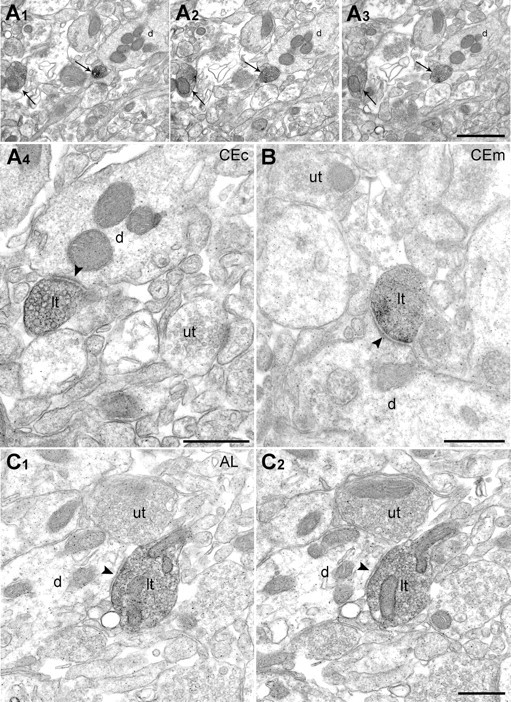
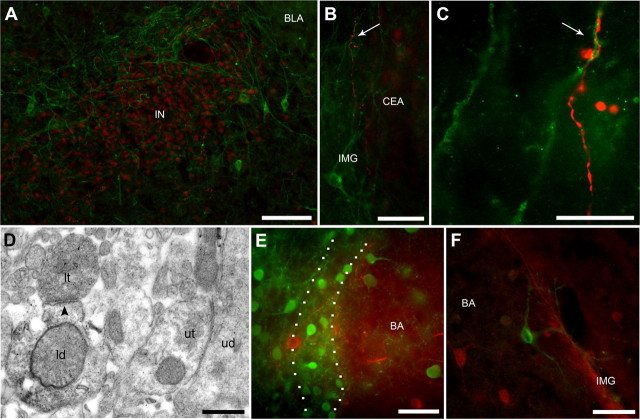
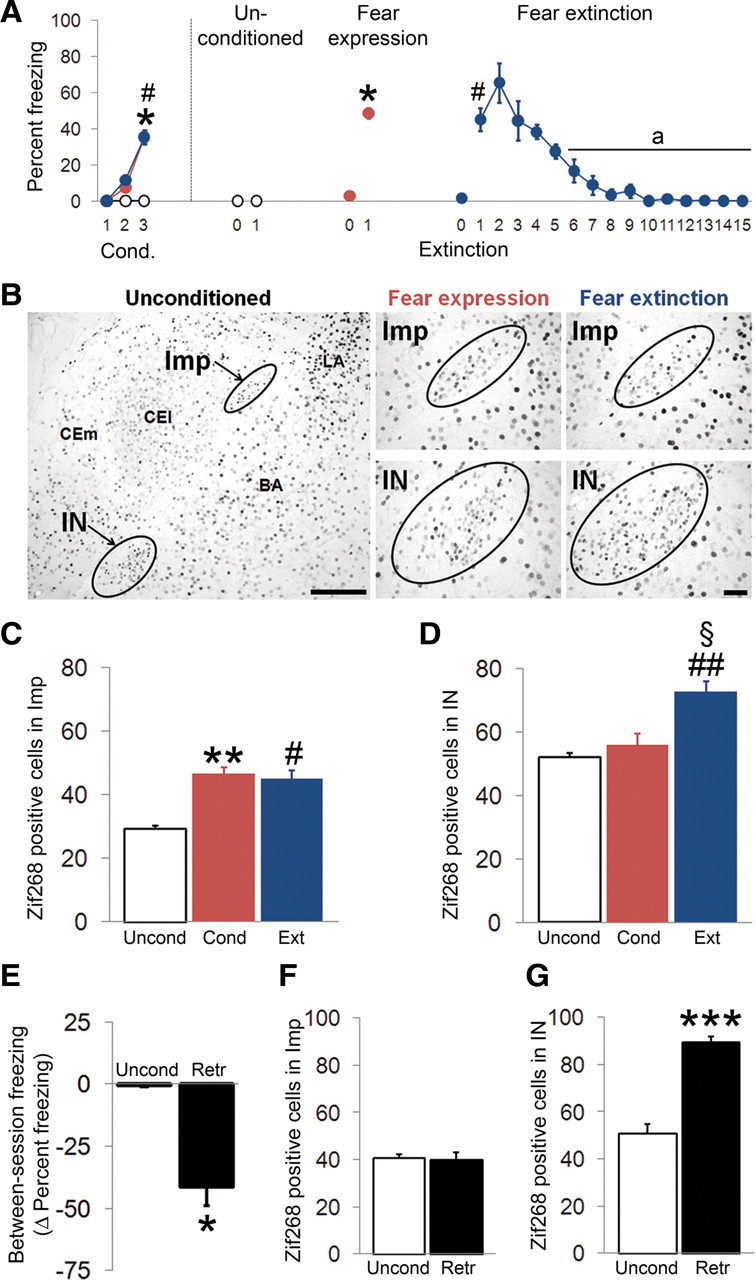
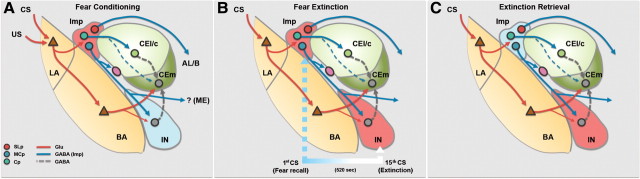
Although extinction-based therapies are among the most effective treatments for anxiety disorders, the neural bases of fear extinction remain still essentially unclear. Recent evidence suggests that the intercalated cell masses of the amygdala (ITCs) are critical structures for fear extinction. However, the neuronal organization of ITCs and how distinct clusters contribute to different fear states are still entirely unknown. Here, by combining whole-cell patch-clamp recordings and biocytin labeling with full anatomical reconstruction of the filled neurons and ultrastructural analysis of their synaptic contacts, we have elucidated the cellular organization and efferent connections of one of the main ITC clusters in mice. Our data showed an unexpected heterogeneity in the axonal pattern of medial paracapsular ITC (Imp) neurons and the presence of three distinct neuronal subtypes. Functionally, we observed that the Imp was preferentially activated during fear expression, whereas extinction training and extinction retrieval activated the main ITC nucleus (IN), as measured by quantifying Zif268 expression. This can be explained by the IPSPs evoked in the IN after Imp stimulation, most likely through the GABAergic monosynaptic innervation of IN neurons by one subtype of Imp cells, namely the medial capsular-projecting (MCp)-Imp neurons. MCp-Imp neurons also target large ITC cells that surround ITC clusters and express the metabotropic glutamate receptor 1α. These findings reveal a distinctive participation of ITC clusters to different fear states and the underlying anatomical circuitries, hence shedding new light on ITC networks and providing a novel framework to elucidate their role in fear expression and extinction.


Figures

Figure 1.
Figure 1.
Full 3D reconstruction and immunohistochemical profile of the ITC clusters of the mouse amygdala. A, B, Medial (A) and lateral (B) views of ITC clusters, CEA (CEc/l in purple; CEm in light purple), and BLA (LA in light blue and BA in blue) of the mouse amygdala. The IN (orange), located ventromedially to the BA, extended rostrally beneath the anterior commissure for considerable length. Rostrocaudally along the intermediate capsule, we observed two discontinuous clusters: the Iap (green) and Imp (red). The intermediate capsule interposed between the Iap/Imp and the IN was identified as IMG (yellow) (de Olmos, 1990). The clusters observed laterally and dorsally to the BLA, previously known as paralaminar nucleus (Amaral and Price, 1984), showed no apparent cellular continuity in mouse and were thus named Ilp (dark green) and supralateral cluster (IsLA, pink), respectively. A small cluster inside the LA was also observed and termed intralateral cluster (IiLA, light green). C–H, Representative micrographs of consecutive sections (bregma levels, −1.46 to −1.70) of the IN, Imp, and Ilp visualized through different immunohistochemical stains: μOR-IR (C), TH-IR (D), GABAA α3-IR (E), cresyl violet (F), FoxP2-IR (G), and GABA-IR (H). Despite each ITC cluster receiving a relatively strong catecholaminergic innervation (TH-IR), as reported previously in rat (Fuxe et al., 2003; Muller et al., 2009), we observed that the caudal half of the IN (D) and the most caudal portion of Imp and Ilp were almost devoid of TH-IR. BA, Basal nucleus of amygdala; CEA, central nucleus of amygdala; Iap, anterior paracapsular ITC cluster; IiLA, intralateral paracapsular ITC cluster; Ilp, lateral paracapsular ITC cluster; IsLA, supralateral ITC cluster; LA, lateral nucleus of amygdala; L, lateral; D, dorsal; C, caudal; R, rostral; V, ventral; M, medial. Scale bars: A, B, 800 μm; C–H, 250 μm.
Figure 2.
Figure 2.
Morphological features and electrophysiological responses of representative Imp neurons. A, Light microscopy image of a representative biocytin-filled in vitro recorded Imp neuron showing its typical bipolar structure. B1, Input resistance of a typical Imp neuron [R013106 1-36 (#7 in cluster analysis dendrogram)] measured referring to the I–V plot. B2, Representative action potential of moderate width evoked by a depolarizing current pulse (1000 pA for 3 s) and used to determine the action potential half-width and amplitude. B3, The adaptation index was estimated on the bases of the sustained firing pattern obtained in response to a longer current stimulus (50 pA for 1 s). B4, A stronger depolarizing current pulse (150 pA for 1 s) was elicited to calculate the maximal firing rate. Scale bar, 50 μm.
Figure 3.
Figure 3.
Morphological features and axonal pattern of a representative CEc neuron. A, B, Light microscopy micrograph (A) and reconstruction by camera lucida (B) of a representative in vitro recorded and biocytin-filled CEc neuron. The soma and dendrites are labeled in red, whereas the axon is marked in blue. The boundaries of the amygdaloid subregions have been drawn referring to the section containing the soma. AStr, Amygdalostriatal transition area; LA, lateral nucleus of amygdala. Scale bars: A, 50 μm; B, 100 μm.
Figure 4.
Figure 4.
Unsupervised cluster analysis identifies three subclasses of Imp neurons. A, The dendrogram illustrates the clustering applied to the sample of 51 Imp neurons. The y-axis represents individual cells, and the x-axis represents the average Euclidian within-cluster linkage distance. Imp neurons were clustered into three subclasses: MCp–Imp neurons (n = 17), in blue; SLp–Imp neurons (n = 16), in red; and Cp–Imp neurons (n = 18) in green. Representative reconstructions of the following: B, an MCp–Imp neuron, showing a major axonal branch traveling along the intermediate capsule to reach the IN; C, SLp–Imp neuron, characterized by a primary axon running alongside the dorsal border of the CEA and reaching the AL; D, Cp–Imp neuron whose axon extensively innervates the CEc and, as in this case, the CEm. In all the reconstructions, soma and dendrites are drawn in red, and the axonal arborization is shown in blue. Delineation of the anatomical boundaries of the different amygdaloid nuclei was drawn on the section containing the soma. AStr, Amygdalostriatal transition area; LA, lateral nucleus of amygdala. Scale bar, 100 μm.
Figure 5.
Figure 5.
Direct inhibitory connectivity between Imp and IN. A, Light micrograph of IN containing a portion of a biocytin-filled axon (arrow) originated from a MCp–Imp neuron. B1, B2, Electron micrographs of serial sections of a biocytin-labeled axon terminal making a symmetric synapse (arrowhead) with a small dendritic shaft in the IN. C1, Representative IPSCs elicited in the IN during extracellular stimulation in the Imp (trace on the left). The minimal stimulation intensity producing a detectable response in the two positive experiments was 20 and 50 μA. In the two positive experiments, the IPSCs rise time was 2.1 and 1.2 ms, peak amplitude was 10 and 26 pA, decay time constant was 15.7 and 10.2 ms, and latency was 6 and 6.1 ms, respectively. The response was mediated by GABAA receptors, because it was abolished by 5 μm bicuculline (trace on the right). Each trace represents the average of 10 sweeps. The IPSCs were evoked at a holding potential of −65 mV. C2, The left panel shows IPSCs evoked in the same cell at increasing stimulation intensities, within the range of 5–40 μA. In the right, the input–output curve shows the relation between the intensity of stimulation used and the peak amplitude of the IPSCs. Each point of the graph represents the average value of three sweeps. Note the presence of failures elicited by lower stimulation intensities and the presence of a plateau for higher stimulation intensities. d, Dendrite; lt, labeled terminal. Scale bars: A, 50 μm; B, 500 nm.
Figure 6.
Figure 6.
Cp–Imp and SLp–Imp neurons establish inhibitory type II synapses on their target neurons. A1–A3, Micrographs of serial ultrathin sections for electron microscopy showing two labeled axon terminals (arrows) in the CEc. A4, Larger magnification of one of these boutons making a symmetric synapse (arrowhead) with a dendritic shaft. B, Symmetric synapse between a labeled axonal terminal of a Cp–Imp neuron and a dendrite of a CEm neuron. C, Serial sections of a biocytin-labeled axon terminal of an SLp–Imp neuron in the AL. d, Dendrite; lt, labeled terminal; ut, unlabeled terminal. Scale bars: A1–A3, 1 μm; A4–C, 500 nm.
Figure 7.
Figure 7.
mGlu1α receptor-immunopositive cells encircle ITC clusters and are targeted by MCp–Imp neurons. A, Double-immunofluorescence micrograph depicting IN clustered neurons immunolabeled for FoxP2 (in red) encircled by the soma and dendrites of large neurons immunolabeled for mGlu1α receptor (in green). B, C, Low-power (B) and high-power (C) micrograph of the filled axon (in red) of a MCp–Imp recorded neuron potentially forming a synaptic contact (arrow) onto a mGlu1α receptor-immunopositive dendrite (in green) within the intermediate capsule. D, Pre-embedding immunoelectron microscopy confirmed that the observed contact is indeed a symmetric synapse (arrowhead). In the ITCs, the soma of neurons containing mGlu1α receptors do not express GABA as revealed by the lack of colabeling between mGlu1α receptor (in red) and GFP (in green) in GAD65-GFP transgenic mice (E) or between mGlu1α receptor (in green) and GABA (in red) (F). ld, Labeled dendrite; lt, labeled terminal. Scale bars: A, 100 μm; B, 50 μm; C, 15 μm; D, 500 nm; E, F, 50 μm.
Figure 8.
Figure 8.
Differential activation of Imp and IN during fear acquisition, extinction, and extinction retrieval. A, Percentage of freezing during each presentation of the CS for the conditioned (CS–US paired) fear expression (red circles), fear extinction (blue circles), and unconditioned (CS-only) control (open black circles) groups. B, Representative photomicrographs of Imp and IN expressing Zif268 in unconditioned control, fear expression, and fear extinction groups in different fear states. C, In the Imp, both the fear expression (red histogram) and fear extinction (blue histogram) groups showed a greater number of Zif268-positive cells relative to unconditioned mice (white histogram). D, In the IN, the fear extinction group showed a greater increase in the number of Zif268-positive cells relative to unconditioned and fear expression groups. E, Between-session extinction freezing changes (measured as fear expression during extinction retrieval minus fear expression during fear recall) in conditioned (black histogram) and unconditioned (white histogram) groups. F, No difference in the number of Zif268-positive cells was observed in the Imp between conditioned and unconditioned mice during retrieval of extinction. G, The fear extinction group displayed an increased number of Zif268-positive cells in the IN relative to unconditioned mice during retrieval of extinction. cond., Fear expression; ext., fear extinction; retr., extinction retrieval; uncond., unconditioned. *p < 0.05, **p < 0.01, fear expression versus unconditioned, #p < 0.05, ##p < 0.01, fear extinction versus unconditioned, §p < 0.05 fear extinction versus fear expression, ap < 0.05 within-group CS presentation versus first CS presentation. Scale bars: B, left, 100 μm; B, middle and right, 40 μm.
Figure 9.
Figure 9.
ITC neurons mediate multiple inhibitory circuits in the amygdala during fear conditioning and extinction. A, Three distinct classes of ITC neurons have been observed in the Imp: (1) MCp–Imp cells (blue circle) directly inhibiting neurons of the IN and large mGlu1α-IR ITC neurons (purple circle) and perhaps sending an axonal branch to the ME; (2) Cp–Imp neurons (green circle) projecting to the CEA; and (3) SLp–Imp cells (red circle) targeting the AL or the nucleus basalis of Meinert (B). During fear conditioning, the selective activation (measured as increased Zif268 expression and schematically shown here as the cluster colored in red) of the Imp by the lateral nucleus of amygdala after CS–US pairings, triggers feedforward inhibition in the IN (shown in light blue) and CEc/l. This leads to the disinhibition of CEm output neurons. B, During fear extinction training, the initial presentation of the CS (light blue dashed arrow) produces fear recall and an ensuing activation of the Imp. Conversely, the persistent presentation of the CS alone (white arrow) leads to the activation of the IN. Therefore, both clusters appear activated because the temporal window of Zif268 activation (>1 h) exceeds the time gap (520 s) between the first and the last (15th) CS exposure. C, During extinction retrieval, only the IN is active, which in turn inhibits the CEm and fear expression. Imp–CEm connections have been shown recently (Mańko et al., 2011). Dashed lines represent pathways that are yet not fully characterized. LA, Lateral nucleus of amygdala; ME, medial nucleus.

References

    1. Airaksinen MS, Eilers J, Garaschuk O, Thoenen K, Konnerth A, Meyer M. Ataxia and altered dendritic calcium signaling in mice carrying a targeted null mutation of the calbindin D28 gene. Proc Nati Acad Sci U S A. 1997;94:1488–1493. - PMC - PubMed
    1. Alheid G, de Olmos J, Beltramino C. Amygdala and extended amygdala. In: Paxinos G, editor. The rat nervous system. Sydney: Academic; 1995. pp. 495–578.
    1. Amano T, Unal CT, Paré D. Synaptic correlates of fear extinction in the amygdala. Nat Neurosci. 2010;13:489–494. - PMC - PubMed
    1. Amaral DG, Price JL. Amygdalo-cortical projections in the monkey (Macaca fascicularis) J Comp Neurol. 1984;230:465–496. - PubMed
    1. Ausubel FM. Short protocols in molecular biology. New York: Wiley; 1992.

Publication types