. 2011 Jun;105(6):2843-51.
doi: 10.1152/jn.00002.2011. Epub 2011 Mar 30.

A spatial explicit strategy reduces error but interferes with sensorimotor adaptation

Affiliations

A spatial explicit strategy reduces error but interferes with sensorimotor adaptation

Bryan L Benson et al. J Neurophysiol. 2011 Jun.

Abstract

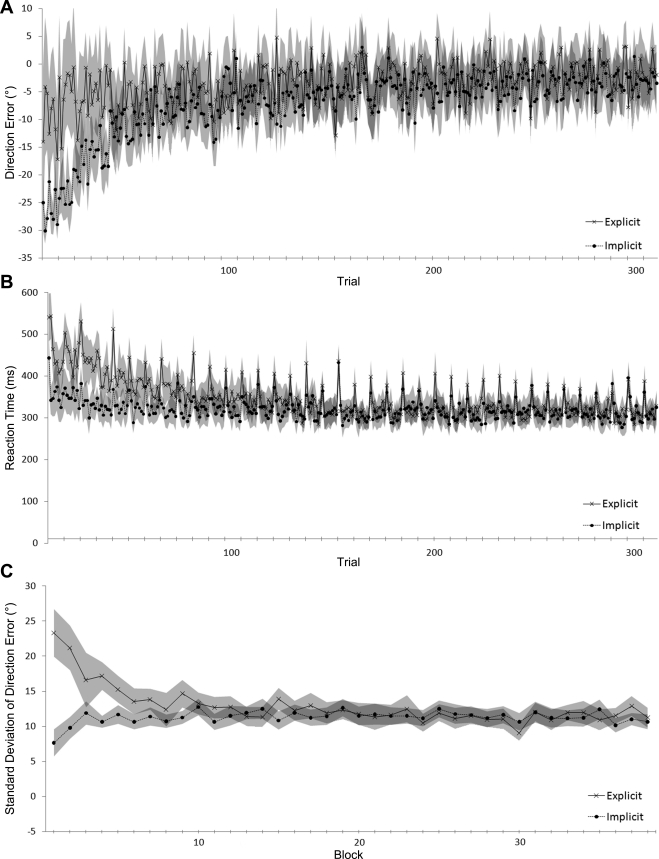
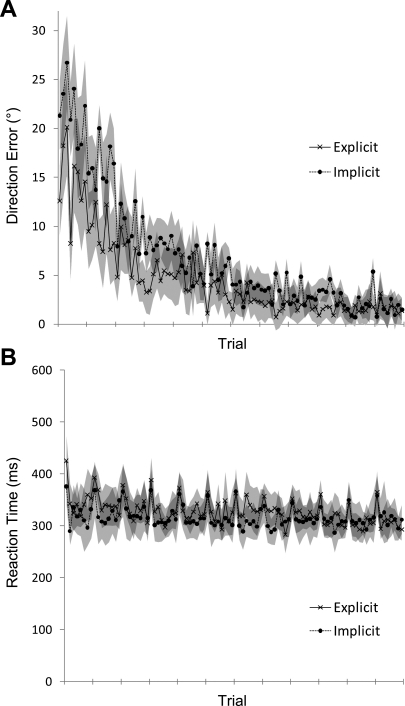
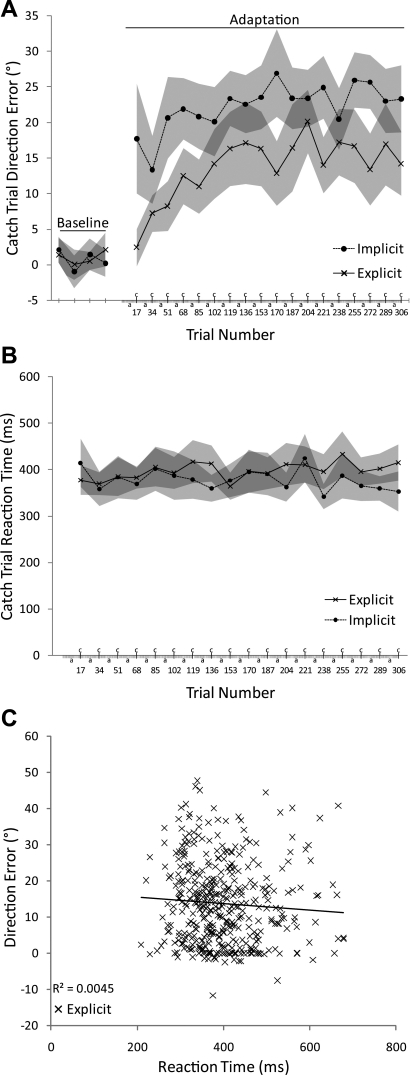
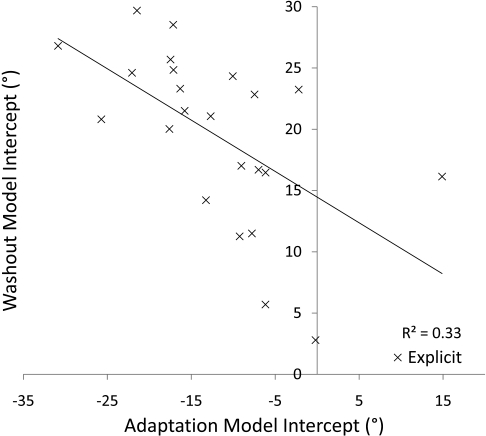
Although sensorimotor adaptation is typically thought of as an implicit form of learning, it has been shown that participants who gain explicit awareness of the nature of the perturbation during adaptation exhibit more learning than those who do not. With rare exceptions, however, explicit awareness is typically polled at the end of the study. Here, we provided participants with either an explicit spatial strategy or no instructions before learning. Early in learning, explicit instructions greatly reduced movement errors but also resulted in increased trial-to-trial variability and longer reaction times. Late in adaptation, performance was indistinguishable between the explicit and implicit groups, but the mechanisms underlying performance improvements remained fundamentally different, as revealed by catch trials. The progression of implicit recalibration in the explicit group was modulated by the use of an explicit strategy: these participants showed a lower level of recalibration as well as decreased aftereffects. This phenomenon may be due to the reduced magnitude of errors made to the target during adaptation or inhibition of implicit learning mechanisms by explicit processing.


Figures

Fig. 1.
Fig. 1.
Actual instruction clock face used in the experiment by 1 representative participant. The circles at 12, 3, 6, and 9 o'clock were drawn by the experimenter to highlight target positions. The lines were drawn by the participant to indicate that he/she understood the direction required to move the joystick to hit the 4 different targets. Lines were hand-drawn in pen on a horizontal surface.
Fig. 2.
Fig. 2.
Flow chart used for polling implicit participants after experiment completion. Explicit awareness was attributed to participants whose answers followed the path of the bold gray arrows or otherwise indicated the use of a rotation-based strategy.
Fig. 3.
Fig. 3.
A: mean direction error (DE) for explicit and implicit participants for every trial in adaptation. Bands indicate 95% confidence intervals of mean DE on each trial. B: mean reaction time (RT) on every trial for explicit and implicit participants across adaptation. Bands indicate 95% confidence intervals of mean RT on each trial. Catch trials are not included; the RT spikes seen in both explicit and implicit groups are on the 1st trial of each block. Explicit participants had significantly higher RT early in adaptation, but this effect disappeared later in adaptation. C: mean standard deviation (SD) of DE for each block of adaptation in both explicit and implicit participants. Explicit participants were significantly more variable early in adaptation, but performance improved across the adaptation period. Bands indicate 95% confidence intervals of the mean SD of each block.
Fig. 4.
Fig. 4.
A: mean DE for explicit and implicit participants for every trial in washout. Bands indicate 95% confidence intervals of mean DE on each trial. B: mean RT for explicit and implicit participants for every trial in washout. Bands indicate 95% confidence intervals of mean RT on each trial.
Fig. 5.
Fig. 5.
A: DE on catch trials for explicit and implicit participants during baseline blocks and adaptation. Bands indicate 95% confidence intervals of the mean at each trial. Fine lines and “a” indicate adaptation trials, and bold lines and “c” indicate catch trails. B: RT on catch trials for explicit and implicit participants during adaptation. Bands indicate 95% confidence intervals of the mean at each trial. C: DE vs. RT on catch trials for explicit participants during adaptation.
Fig. 6.
Fig. 6.
Intercepts of the exponential DE learning curves for washout vs. adaptation in explicit participants.

Similar articles

Cited by

References

    1. Abeele S, Bock O. Mechanisms for sensorimotor adaptation to rotated visual input. Exp Brain Res 139: 248–253, 2001 - PubMed
    1. Anguera JA, Reuter-Lorenz PA, Willingham DT, Seidler RD. Contributions of spatial working memory to visuomotor learning. J Cogn Neurosci 22: 1917–1930, 2010 - PubMed
    1. Arce F, Novick I, Shahar M, Link Y, Ghez C, Vaadia E. Differences in context and feedback result in different trajectories and adaptation strategies in reaching. PLoS One 4: e4214, 2009 - PMC - PubMed
    1. Beilock SL, Carr TH. On the fragility of skilled performance: what governs choking under pressure? J Exp Psychol Gen 130: 701–725, 2001 - PubMed
    1. Beilock SL, Carr TH, MacMahon C, Starkes JL. When paying attention becomes counterproductive: impact of divided versus skill-focused attention on novice and experienced performance of sensorimotor skills. J Exp Psychol Appl 8: 6–16, 2002 - PubMed

Publication types

LinkOut - more resources