. 2011 Jun;105(6):2989-3001.
doi: 10.1152/jn.01041.2010. Epub 2011 Mar 30.

Both visual and idiothetic cues contribute to head direction cell stability during navigation along complex routes

Affiliations

Both visual and idiothetic cues contribute to head direction cell stability during navigation along complex routes

Ryan M Yoder et al. J Neurophysiol. 2011 Jun.

Abstract

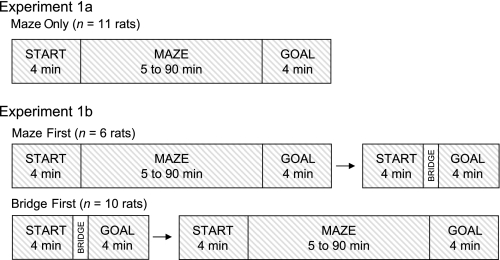
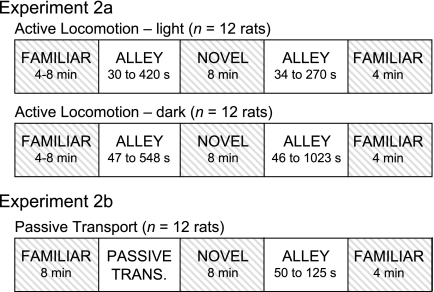
Successful navigation requires a constantly updated neural representation of directional heading, which is conveyed by head direction (HD) cells. The HD signal is predominantly controlled by visual landmarks, but when familiar landmarks are unavailable, self-motion cues are able to control the HD signal via path integration. Previous studies of the relationship between HD cell activity and path integration have been limited to two or more arenas located in the same room, a drawback for interpretation because the same visual cues may have been perceptible across arenas. To address this issue, we tested the relationship between HD cell activity and path integration by recording HD cells while rats navigated within a 14-unit T-maze and in a multiroom maze that consisted of unique arenas that were located in different rooms but connected by a passageway. In the 14-unit T-maze, the HD signal remained relatively stable between the start and goal boxes, with the preferred firing directions usually shifting <45° during maze traversal. In the multiroom maze in light, the preferred firing directions also remained relatively constant between rooms, but with greater variability than in the 14-unit maze. In darkness, HD cell preferred firing directions showed marginally more variability between rooms than in the lighted condition. Overall, the results indicate that self-motion cues are capable of maintaining the HD cell signal in the absence of familiar visual cues, although there are limits to its accuracy. In addition, visual information, even when unfamiliar, can increase the precision of directional perception.


Figures

Fig. 1.
Fig. 1.
The 14-unit T-maze. A: photo of the 14-unit T-maze with a rat confined to the goal box. Note: the vertically oriented stripes in the goal box that distinguish it from the start box were added after the photo was taken. B: overhead schematic of the 14-unit T-maze. Solid lines represent walls; arrows indicate path between start and goal boxes; dashed line indicates the start point for the MAZE END condition.
Fig. 2.
Fig. 2.
The multiroom apparatus. A square arena (A) was located in room 1 with an 11.4-m passageway (B) connecting it to a novel cylinder containing 8 uniformly spaced black curtains (C) in room 2. For the dark condition, a roof (D) was positioned on top of the passageway to prevent visual continuity between rooms. A small slit ran down the middle of the roof to allow the recording cable to pass through. E: overhead schematic of the multiroom apparatus drawn to approximate scale.
Fig. 3.
Fig. 3.
Recording procedures for experiment 1. For experiment 1a, head direction (HD) cell activity was recorded while the rat was confined to the start box, during maze traversal, and while the rat was confined to the goal box. In experiment 1b, the same procedure was followed, with the addition of a single bridge trial after 3 maze trials for the MAZE FIRST group. For the BRIDGE FIRST group, 3 bridge trials occurred before a single maze trial. The amount of time spent in the maze varied across rats, and the time ranges are shown for each experiment.
Fig. 4.
Fig. 4.
Recording procedures for experiments 2a and 2b. For both experiments, HD cell activity was recorded while rats were in the familiar and novel arenas. Shaded areas indicate sessions during which HD cell activity was not recorded. The amount of time spent in the alleyway varied across rats, and the time ranges are shown for each experiment.
Fig. 5.
Fig. 5.
Directional tuning curves for 3 representative HD cells recorded during performance of the 14-unit maze. A and B: during traversal of the maze, the preferred direction of HD cells showed a slight shift between the start box and maze end. The amount of time in which the animal's head was pointed within each 6° directional bin during the MAZE END condition (directional sampling) is indicated by the dashed line. In A, the cell's preferred firing direction shifted 30° clockwise (CW) between the start box and maze end. On entry to the goal box, however, the preferred direction shifted 42° counterclockwise (CCW) and was 12° CCW relative to the start box. In B, the cell's preferred firing direction shifted 12° CW between the start box and maze end. On entry to the goal box, the preferred firing direction shifted 24° CCW to become 6° CCW relative to the start box. C: during traversal of the linear bridge that connected the start and goal boxes, the preferred direction shifted −6°.
Fig. 6.
Fig. 6.
Distribution of shifts in the preferred firing direction of cells recorded during the 14-unit T-maze. For all plots, 0° represents each cell's preferred direction during the first recording session in room 1. A, left: after locomotion from the start box to the goal box via the maze, the mean shift in the preferred directions did not differ from 0°. Right, during the second half of the maze (before entry to the goal box), the preferred directions showed a significant shift, relative to the start box, as well as to the START vs. GOAL comparison at left. B: rats that used the bridge to navigate from the start box to the goal box showed little shift in the cells' preferred directions after traversing the bridge to the goal box. Shaded lines represent 95% confidence intervals. Points that fell between 6° bins are due to sessions that contained multiple cell recordings, and the point represents the average shifts of the preferred firing directions.
Fig. 7.
Fig. 7.
Absolute angular shift of the preferred firing direction as a function of time in maze. A: during traversal of the maze, time was not significantly correlated with the amount of shift in the preferred firing direction between start and goal boxes (Pearson r = 0.366). B: between the start box and maze end, time in the maze was not correlated with the amount of shift in the preferred firing direction (Pearson r = −0.369). PFD, preferred firing direction.
Fig. 8.
Fig. 8.
Directional tuning curves for 3 representative HD cells recorded during performance of the multiroom maze. A: during active locomotion in light, this cell's preferred direction remained relatively stable between the familiar and novel arenas, with a shift of 6°. On return to the familiar arena, the preferred direction also remained constant, with a shift of 6° relative to that of the first session in the familiar arena. B: during active locomotion in darkness, the preferred direction showed slightly less stability, with a shift of 30°. On return to the familiar arena, the preferred direction returned to its original alignment, with a shift of 0°. C: during passive transport, the preferred direction shifted −78°, only to become precisely realigned on return to the familiar arena, with a shift of 0°.
Fig. 9.
Fig. 9.
Distribution of shifts in the preferred firing direction across cells recorded during the multiroom task. For all plots, 0° represents each cell's preferred direction during the first recording session in room 1. Dashed circle indicates 0.05 significance criterion. A: during active locomotion from room 1 to room 2 (Outbound) in light, the distribution of shifts of the preferred direction was small and did not differ from 0°. After the return journey from room 2 to room 1 (Return), the distribution of shifts of the preferred direction did not differ from 0°. B: during active locomotion in darkness, the distribution of shifts of the preferred direction was again centered around 0°, but there was a larger range of shift values. After return to room 1, preferred firing directions returned to their original orientation. C: when rats were disoriented and passively transported between rooms, the preferred firing directions shifted to random values. After the return journey, however, the preferred firing directions returned to their previously established orientations. Points that fell between 6° bins are due to sessions that contained multiple cell recordings, and the point represents the average shifts of the preferred firing directions.
Fig. 10.
Fig. 10.
Absolute angular shift of preferred firing direction as a function of time in alley. A: during active locomotion in light, time was not significantly correlated with the amount of shift in the preferred firing direction between arenas (r = −0.405). B: during active locomotion in darkness, time in the alley was not significantly correlated with the amount of shift in the cell's preferred firing direction (r = −0.129).

References

    1. Bassett JP, Tullman ML, Taube JS. Lesions of the tegmentomammillary circuit in the head direction cell system disrupt the head direction signal in the anterior thalamus. J Neurosci 27: 7564–7577, 2007 - PMC - PubMed
    1. Batschelet E. Circular Statistics in Biology. New York: Academic, 1981
    1. Benhamou S, Sauvé JP, Bovet P. Spatial memory in large-scale environments: efficiency and limitations of the egocentric coding process. J Theor Biol 145: 1–12, 1990
    1. Bingman VP, Cheng K. Mechanisms of animal global navigation: comparative perspectives and enduring challenges. Ethol Ecol Evol 17: 295–318, 2005
    1. Blair HT, Sharp PE. Visual and vestibular influences on head-direction cells in the anterior thalamus of the rat. Behav Neurosci 110: 643–660, 1996 - PubMed

Publication types

LinkOut - more resources