

Review
doi: 10.1038/nmeth.1573.
Epub 2011 Mar 30.
Validating transcripts with probes and imaging technology
Affiliations
- PMID: 21451512
- PMCID: PMC3158979
- DOI: 10.1038/nmeth.1573
Item in Clipboard
Review
Validating transcripts with probes and imaging technology
Nat Methods.
2011 Apr.
Abstract
High-throughput gene expression screens provide a quantitative picture of the average expression signature of biological samples. However, the analysis of spatial gene expression patterns with single-cell resolution requires quantitative in situ measurement techniques. Here we describe recent technological advances in RNA fluorescence in situ hybridization (FISH) techniques that facilitate detection of individual fluorescently labeled mRNA molecules of practically any endogenous gene. These methods, which are based on advances in probe design, imaging technology and image processing, enable the absolute measurement of transcript abundance in individual cells with single-molecule resolution.
Figures
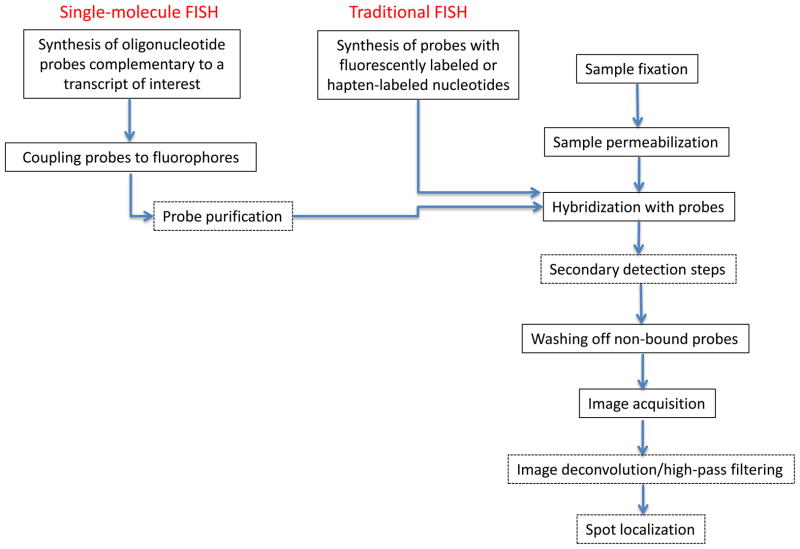
Common steps in ISH. Dashed boxes are method-specific steps. Hapten coupling requires a secondary light-emitting reaction. Single-molecule FISH requires image enhancement in the form of deconvolutionor high-pass filtering of the image stacks, followed by automatic spot localization.
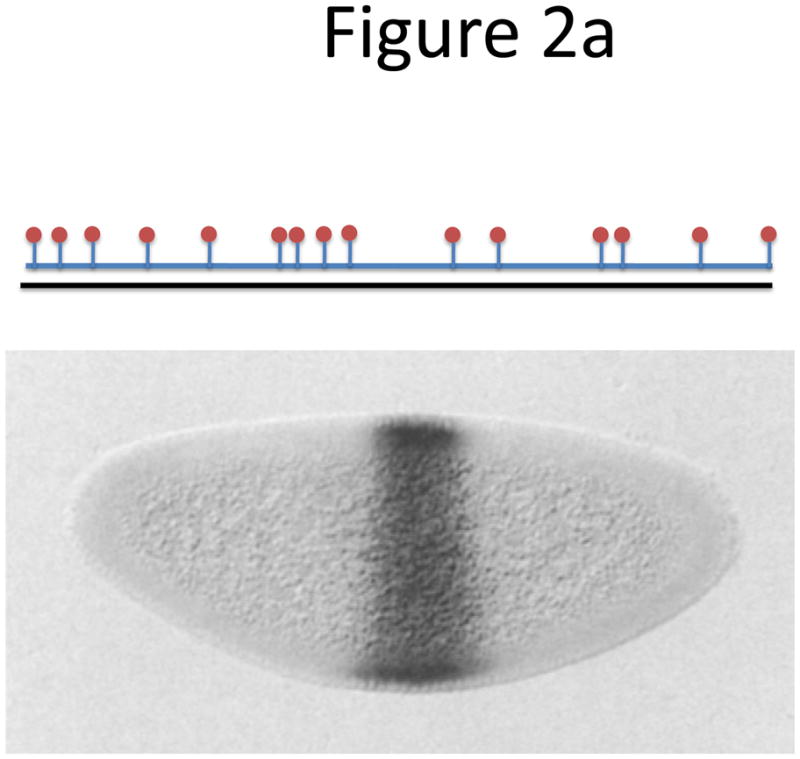
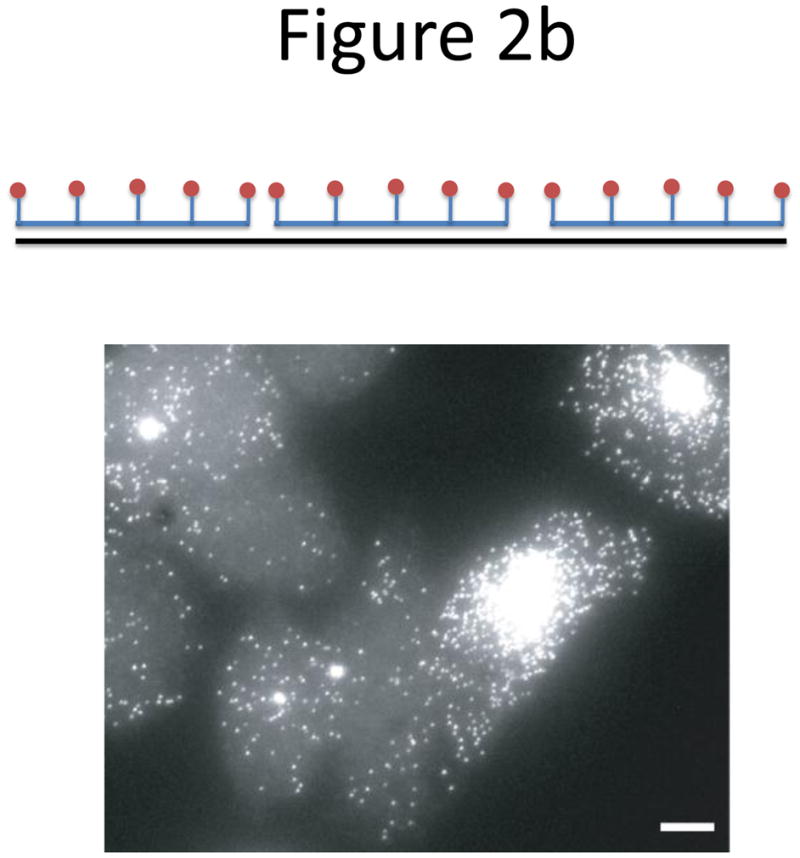
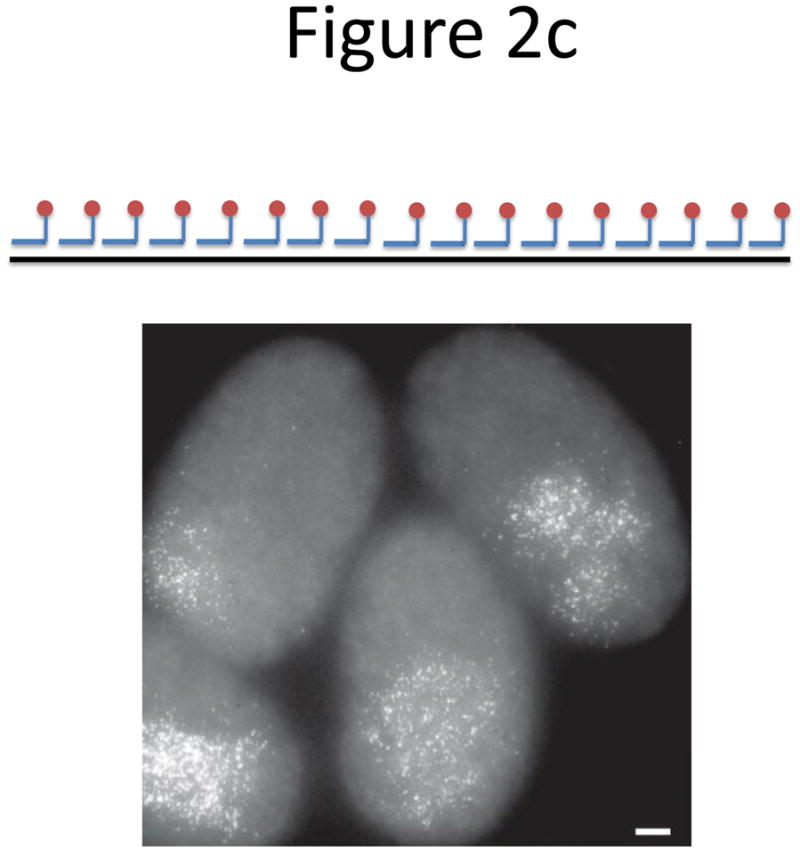
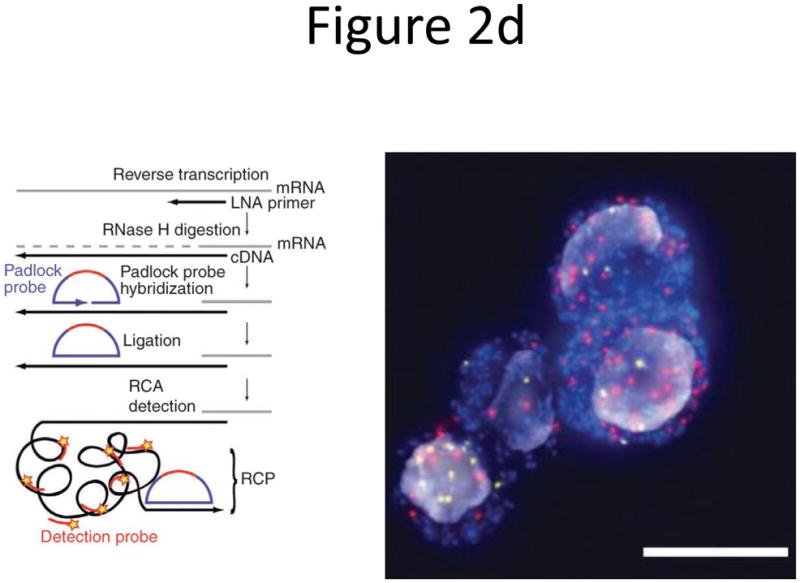
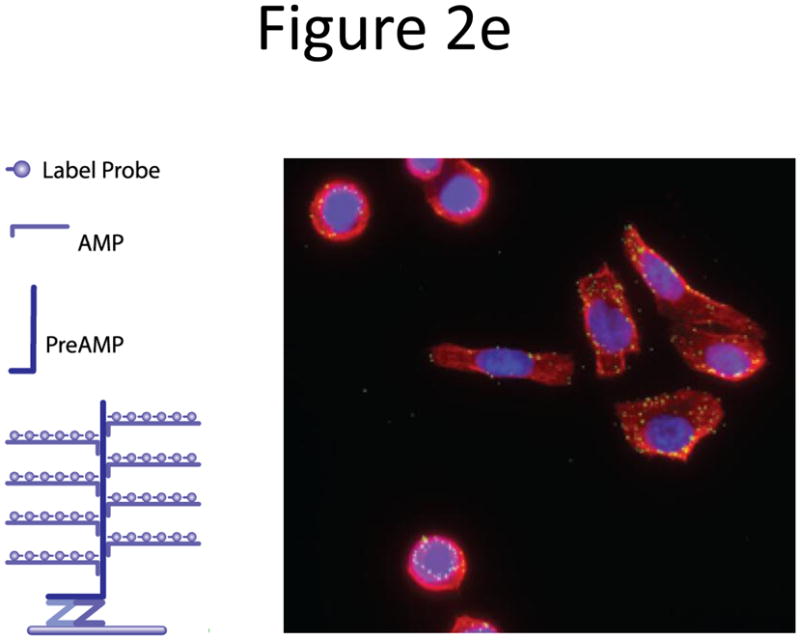
Probe designs for ISH. (a) Schematic of long probes with randomly distributed labeled nucleotides (top) and Drosophila embryo hybridized with probes complementary to the hunchback gene (bottom; reprinted from ref. 77). (b) Schematic of shorter probes, each coupled to 3–5 labeled nucleotides (top) and fluorescence image, showing single mRNA transcripts in mammalian cells (bottom; reprinted from ref. 26). Scale bar, 5 μm. (c) Schematic of multiple singly labeledshorter probes (top) and C. elegans embryos hybridized with probes complementary to the end-1 gene (bottom; reprinted from ref. 31). Scale bar, 5 μm. (d) Illustration of rolling-circle amplification (RCA) of padlock probes; fluorescent probes bind their complementary sequences in the rolling circle product (RCP) (left). Fluorescence image (right) illustrates detection of ERBB2 (also known as HER2; red), MYC (yellow) and ACTB (blue) transcripts in primary human fibroblast cultures (reprinted from ref. 34). Scale bar, 20 μm. (e) Schematic of a branched DNA detection method using four probe sets. Multiple label probes bind multiple amplifier molecules that are in turn bound to a pre-amplifier molecule that binds the transcript-specific probe pairs. Image of ERBB2 (green) and 18S rRNA (red) in SKBR3 cells (right; reprinted from http://www.panomics.com/ ).
Probe designs for ISH. (a) Schematic of long probes with randomly distributed labeled nucleotides (top) and Drosophila embryo hybridized with probes complementary to the hunchback gene (bottom; reprinted from ref. 77). (b) Schematic of shorter probes, each coupled to 3–5 labeled nucleotides (top) and fluorescence image, showing single mRNA transcripts in mammalian cells (bottom; reprinted from ref. 26). Scale bar, 5 μm. (c) Schematic of multiple singly labeledshorter probes (top) and C. elegans embryos hybridized with probes complementary to the end-1 gene (bottom; reprinted from ref. 31). Scale bar, 5 μm. (d) Illustration of rolling-circle amplification (RCA) of padlock probes; fluorescent probes bind their complementary sequences in the rolling circle product (RCP) (left). Fluorescence image (right) illustrates detection of ERBB2 (also known as HER2; red), MYC (yellow) and ACTB (blue) transcripts in primary human fibroblast cultures (reprinted from ref. 34). Scale bar, 20 μm. (e) Schematic of a branched DNA detection method using four probe sets. Multiple label probes bind multiple amplifier molecules that are in turn bound to a pre-amplifier molecule that binds the transcript-specific probe pairs. Image of ERBB2 (green) and 18S rRNA (red) in SKBR3 cells (right; reprinted from http://www.panomics.com/ ).
Probe designs for ISH. (a) Schematic of long probes with randomly distributed labeled nucleotides (top) and Drosophila embryo hybridized with probes complementary to the hunchback gene (bottom; reprinted from ref. 77). (b) Schematic of shorter probes, each coupled to 3–5 labeled nucleotides (top) and fluorescence image, showing single mRNA transcripts in mammalian cells (bottom; reprinted from ref. 26). Scale bar, 5 μm. (c) Schematic of multiple singly labeledshorter probes (top) and C. elegans embryos hybridized with probes complementary to the end-1 gene (bottom; reprinted from ref. 31). Scale bar, 5 μm. (d) Illustration of rolling-circle amplification (RCA) of padlock probes; fluorescent probes bind their complementary sequences in the rolling circle product (RCP) (left). Fluorescence image (right) illustrates detection of ERBB2 (also known as HER2; red), MYC (yellow) and ACTB (blue) transcripts in primary human fibroblast cultures (reprinted from ref. 34). Scale bar, 20 μm. (e) Schematic of a branched DNA detection method using four probe sets. Multiple label probes bind multiple amplifier molecules that are in turn bound to a pre-amplifier molecule that binds the transcript-specific probe pairs. Image of ERBB2 (green) and 18S rRNA (red) in SKBR3 cells (right; reprinted from http://www.panomics.com/ ).
Probe designs for ISH. (a) Schematic of long probes with randomly distributed labeled nucleotides (top) and Drosophila embryo hybridized with probes complementary to the hunchback gene (bottom; reprinted from ref. 77). (b) Schematic of shorter probes, each coupled to 3–5 labeled nucleotides (top) and fluorescence image, showing single mRNA transcripts in mammalian cells (bottom; reprinted from ref. 26). Scale bar, 5 μm. (c) Schematic of multiple singly labeledshorter probes (top) and C. elegans embryos hybridized with probes complementary to the end-1 gene (bottom; reprinted from ref. 31). Scale bar, 5 μm. (d) Illustration of rolling-circle amplification (RCA) of padlock probes; fluorescent probes bind their complementary sequences in the rolling circle product (RCP) (left). Fluorescence image (right) illustrates detection of ERBB2 (also known as HER2; red), MYC (yellow) and ACTB (blue) transcripts in primary human fibroblast cultures (reprinted from ref. 34). Scale bar, 20 μm. (e) Schematic of a branched DNA detection method using four probe sets. Multiple label probes bind multiple amplifier molecules that are in turn bound to a pre-amplifier molecule that binds the transcript-specific probe pairs. Image of ERBB2 (green) and 18S rRNA (red) in SKBR3 cells (right; reprinted from http://www.panomics.com/ ).
Probe designs for ISH. (a) Schematic of long probes with randomly distributed labeled nucleotides (top) and Drosophila embryo hybridized with probes complementary to the hunchback gene (bottom; reprinted from ref. 77). (b) Schematic of shorter probes, each coupled to 3–5 labeled nucleotides (top) and fluorescence image, showing single mRNA transcripts in mammalian cells (bottom; reprinted from ref. 26). Scale bar, 5 μm. (c) Schematic of multiple singly labeledshorter probes (top) and C. elegans embryos hybridized with probes complementary to the end-1 gene (bottom; reprinted from ref. 31). Scale bar, 5 μm. (d) Illustration of rolling-circle amplification (RCA) of padlock probes; fluorescent probes bind their complementary sequences in the rolling circle product (RCP) (left). Fluorescence image (right) illustrates detection of ERBB2 (also known as HER2; red), MYC (yellow) and ACTB (blue) transcripts in primary human fibroblast cultures (reprinted from ref. 34). Scale bar, 20 μm. (e) Schematic of a branched DNA detection method using four probe sets. Multiple label probes bind multiple amplifier molecules that are in turn bound to a pre-amplifier molecule that binds the transcript-specific probe pairs. Image of ERBB2 (green) and 18S rRNA (red) in SKBR3 cells (right; reprinted from http://www.panomics.com/ ).
References
Publication types
MeSH terms
Substances
Grants and funding
LinkOut - more resources
Full Text Sources
Other Literature Sources
