Review
. 2011 Apr;8(4 Suppl):S20-9.
doi: 10.1038/nmeth.1549. Epub 2011 Mar 30.

Profiling metabolites and peptides in single cells

Affiliations
Review

Profiling metabolites and peptides in single cells

Stanislav S Rubakhin et al. Nat Methods. 2011 Apr.

Abstract

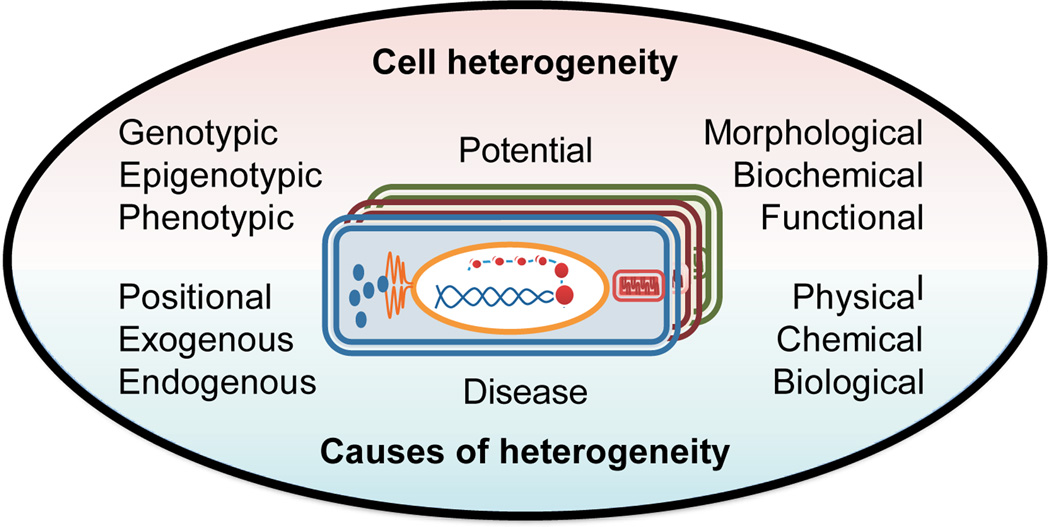
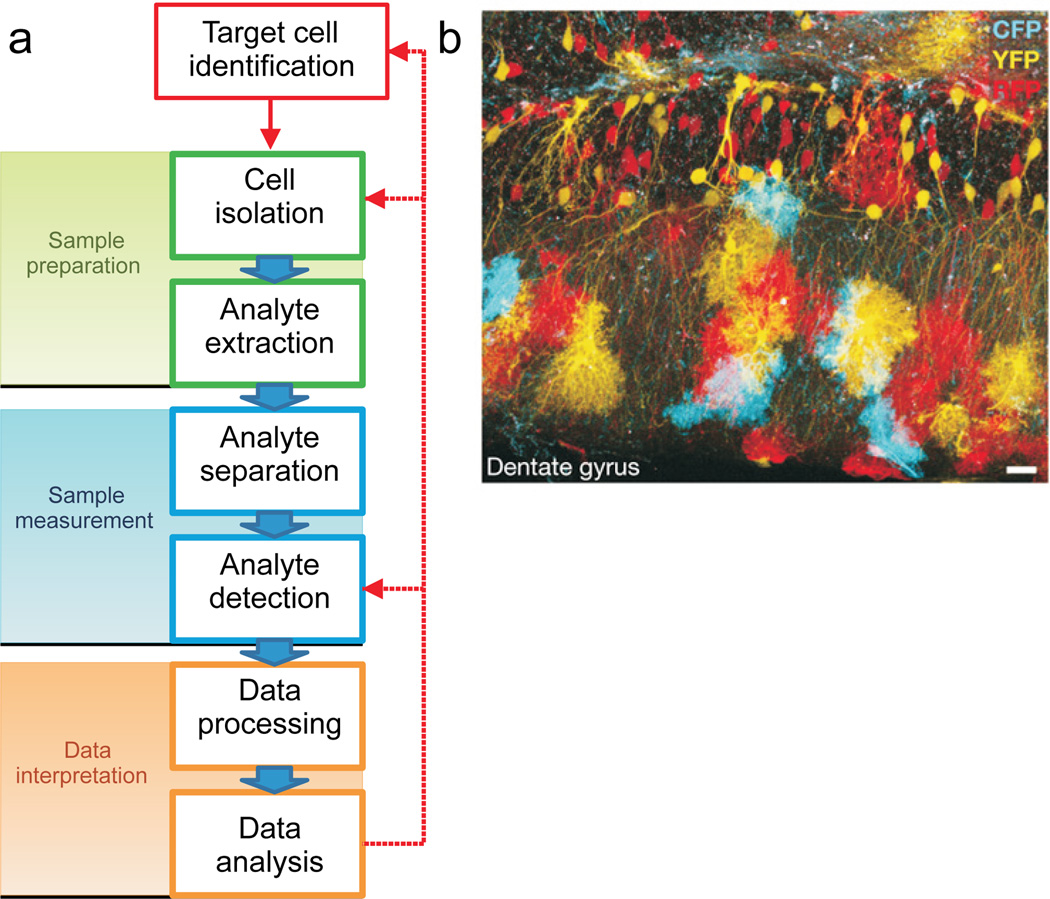
The intracellular levels and spatial localizations of metabolites and peptides reflect the state of a cell and its relationship to its surrounding environment. Moreover, the amounts and dynamics of metabolites and peptides are indicative of normal or pathological cellular conditions. Here we highlight established and evolving strategies for characterizing the metabolome and peptidome of single cells. Focused studies of the chemical composition of individual cells and functionally defined groups of cells promise to provide a greater understanding of cell fate, function and homeostatic balance. Single-cell bioanalytical microanalysis has also become increasingly valuable for examining cellular heterogeneity, particularly in the fields of neuroscience, stem cell biology and developmental biology.


Figures

Figure 1
Figure 1
Cell-to-cell heterogeneity has many different manifestations and causes. "Potential heterogeneity" reflects the cell’s capability to change its function, chemical composition, and structure under influences of its physical and chemical environments. One goal of metabolomics/peptidomics is to enable predictions on which cell(s) will become cancerous and to determine what extracellular or intracellular stimuli are needed for this transformation.
Figure 2
Figure 2
A variety of approaches allow the visualization of cells to enable subsequent isolation and characterization. (a) Typical workflow for single-cell metabolomic and/or peptidomic analysis outlining the major experimental steps; cell-selection approaches are greatly aided when the cells are labeled. (b) The Brainbow mouse involves the stochastic combinatorial expression of multiple fluorescent proteins, with neurons and astrocytes from the dentate gyrus shown here; such labeling schemes allow selection of specific cells for assay. Used with permission from Nature Publications.
Figure 3
Figure 3
Microfluidic devices are of growing importance in SCMP investigations. Here, a microfluidic device with functionalized gold surfaces allows chemical stimulation of individual cultured neurons, collection of stimulated release, and characterization of released peptides using off-line mass spectrometry. (a) Schematic of the device containing a cell compartment and three fluidic channels used for released peptide collection. (b) Cultured neuron in the microchannel prior to stimulation. Scale bar = 100 μm. (c) MS image of the (1) prestimulation, (2) stimulation, and (3) poststimulation channels showing that peptides are only collected during chemical stimulation of the neuron. (d) Representative mass spectra of the prestimulation channel showing only background peaks (top) and from the stimulation channel showing several known neuropeptide peaks (bottom). Used with permission from the Royal Society of Chemistry.
Figure 4
Figure 4
A variety of vacuum-based MS methods have been used for single-cell SCMP investigations. (a) Secondary ion MS is used to visualize and identify the phospholipid distribution changes that occur during conjugation of the Tetrahymena thermophila (top panel). Normalized phosphatidylcholine ion images and (bottom panel) line scans for the phosphatidylcholine and C5H9 across cell–cell junctions at 1 h and 3 h, respectively, reveal the temporal evolution of the lipid domains formed during these processes. Scale bar denotes 50 μm. Used with permission by the National Academy of Sciences. (b) MALDI MS reveals the metabolic individuality of Closterium acerosum cells (microscope pictures in inset) obtained from different cultures (top to bottom). For reference, the lowest trace shows a spectrum from the blank (no cell deposited on the MALDI plate). Yellow bars highlight spectral features associated with the cells. The scale bar denotes 200 μm. Used with permission from the American Chemical Society. (c) Relative quantification of neuropeptides is possible using MALDI MS of single neurons via appropriate labeling reactions. Top mass spectrum represents the peptide profile of an individual CFT neuron before labeling. Two bottom mass spectra acquired from mixtures of two different pairs of CFT cells, enabling changes in peptide contents between cells to be measured. Used with permission from the American Chemical Society.
Figure 5
Figure 5
Ambient ionization MS allows fast sampling from living single cells followed by immediate sample analysis. (a) Video-MS probes (left middle panel) the granules from a mast cell and identifies (left bottom panel) histamine by tandem MS. Adapted with permission from Wiley-Blackwell. (b) LAESI MS interrogates a single cell of an Allium cepa cultivar in noncontact mode (left panel) showing a sharpened optical fiber, and yielding mass spectra that reveal different metabolic composition for neighboring (middle panel) colorless and (right panel) pigmented epidermal cells, with the optical image of the cells in the inset (scale bar = 50 μm). Adapted with permission from the American Chemical Society.

References

    1. Hausser M. Nat. Neurosci. 2000;3 Suppl:1165. - PubMed
    1. Hubel David H, Wiesel Torsten N. Brain and visual perception: the story of a 25-year collaboration. New York, N.Y.: Oxford University Press; 2005.
    1. Goaillard JM, Taylor AL, Schulz DJ, et al. Nat. Neurosci. 2009;12:1424–1430. - PMC - PubMed
    1. Moroz LL, Gillette R, Sweedler JV. J. Exp. Biol. 1999;202:333–341. - PubMed
    1. Brecht M, Schneider M, Sakmann B, et al. Nature. 2004;427:704–710. - PubMed

Publication types