. 2010 Sep;94(2):161-74.
doi: 10.1901/jeab.2010.94-161.

Dynamics of choice: a tutorial

Affiliations

Dynamics of choice: a tutorial

William M Baum. J Exp Anal Behav. 2010 Sep.

Abstract

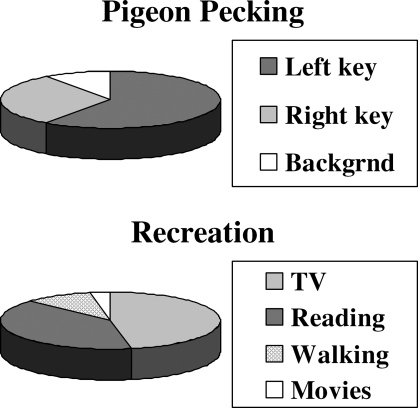
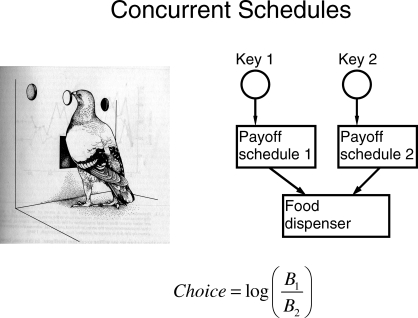
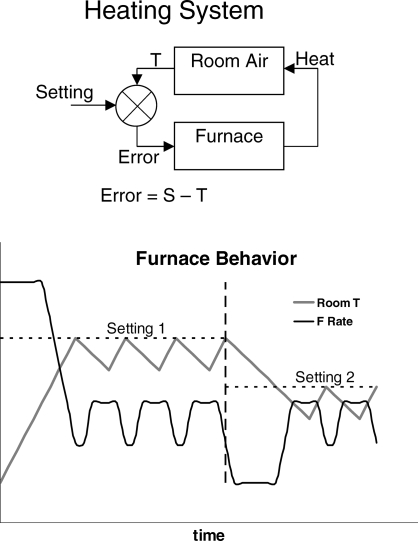
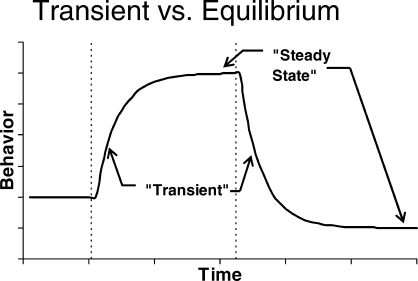
Choice may be defined as the allocation of behavior among activities. Since all activities take up time, choice is conveniently thought of as the allocation of time among activities, even if activities like pecking are most easily measured by counting. Since dynamics refers to change through time, the dynamics of choice refers to change of allocation through time. In the dynamics of choice, as in other dynamical systems that include feedback, change is away from perturbation and toward a steady state. Steady state or equilibrium is assessed on a longer time scale than change because change is only visible on a smaller time scale. When we compare laws of equilibrium, such as the matching law with laws of dynamics, two possibilities emerge. Self-similarity occurs when the same law can be seen across smaller time scales, with the result that the law at longer time scales may be understood as the expression of its application at smaller time scales. Reduction occurs when the dynamics at a small time scale are incommensurate with the dynamics at longer time scales. Then the process at the longer time scale is reduced to a qualitatively different process at the smaller time scale, as when choice is reduced to switching patterns. When reduction occurs, the dynamics at the longer time scale may be derived from the process at the smaller time scale, but not the other way around. Research at different time scales is facilitated by the molar view of behavior.

Keywords: bouts; choice; dynamics; equilibrium; matching law; molar view; steady state; switching; time scale.


Figures

Fig 1
Fig 1
Hypothetical examples illustrating the concept of allocation. Choice is the allocation of time among activities.
Fig 2
Fig 2
A typical experimental arrangement for studying and measuring choice. Drawing reprinted with the author's permission from Hall (1983), page 43.
Fig 3
Fig 3
A heating system as an example of a feedback system. Top: diagram of the feedback system showing error controlling feedback. Bottom: the behavior of the system in response to changes in setting. The broken vertical line indicates a change in setting.
Fig 4
Fig 4
The pattern of transient adjustment to equilibrium or steady state expected from a feedback system like that in Figure 3. Condition changes are indicated by broken vertical lines.
Fig 5
Fig 5
One pigeon's session-by-session choice in three conditions, each a different food ratio (Baum et al., 1999). Filled triangles indicate the first session of a new condition. The 64∶1 food ratio followed a 1∶9 food ratio.
Fig 6
Fig 6
The matching relation across steady-state estimates of choice based on several sessions (Baum et al., 1999). The regression line shows the relation between log (base 2) behavior ratio (allocation) and log (base 2) food ratio. The slope of 0.8 shows undermatching.
Fig 7
Fig 7
Within-session dynamics in an experiment by Mazur (1992). The first point in each curve represents the final 15 min of performance on equal concurrent variable-interval schedules (50/50), and the curves show choice in 9- and 15-min blocks of the first session after a change in food ratio from 50/50 to 90/10, 75/25, or 60/40. Choice moves toward a new level appropriate to the new food ratio.
Fig 8
Fig 8
Choice on a smaller time scale in Mazur's (1992) experiment. The first point in each curve represents choice across all first pecks following food in a sample of 500 pecks. The second point represents choice across all second pecks, and so on. Choice is shown peck by peck for the lean alternative (lower graph) and the rich alternative (upper graph) in each of the three conditions of Figure 7 at the end of five sessions of exposure. Preference pulses are evident in the 90/10 condition, and only following food from the lean key in the 60/40 condition.
Fig 9
Fig 9
The same data from Baum et al. (1999) as in Figure 5 replotted to show session by session the average number of pecks in a visit to the lean key (squares; vertical axis on the right) and the probability of visiting the lean key (triangles; vertical axis on the left). Pecks per visit (vertical axis on the right) was transformed by adding one and taking the logarithm. Filled symbols show the first session of a new condition. The brief visits to the lean key and the graded probabilities of visiting the lean key are consistent with a fix-and-sample pattern of responding on the two keys.
Fig 10
Fig 10
The first session of each of three conditions in the Baum et al. (1999) experiment shown visit by visit as the visits alternate between the left and right keys. The vertical axis represents the same transform of visit length as in Figure 9, except that visits to the right are represented as negative. The length of each vertical line shows the length of one visit. Small diamonds show food deliveries. Triangles and squares show transformed visit length in the final stable state of a condition; the ones on the left are for the preceding condition, and the ones on the right are for the new condition. The absence of any pecks following food from the lean key (zero-length visit) appears as a square on the horizontal axis. The dominance of one-peck visits to the lean key appears as a triangle at 1 or −1. Each graph shows one entire session. At the beginning of the session, the pattern of visits is appropriate to the prior condition, and at some point during the session (circled) the pattern switches to favoring the newly rich key; visits to the rich key become long, and visits to the lean key become brief.
Fig 11
Fig 11
The same data as in Figure 10 replotted to show the relatively abrupt transition in switching pattern. The lighter line shows cumulated food (vertical axis on the right) calculated by adding +1 for a food delivery from the left key and −1 for a food delivery from the right key. The line begins at zero, and the slope shows which was the richer alternative. The thicker line (diamonds) shows cumulated pecks calculated by adding the pecks in each visit to the left key and subtracting the pecks in each visit to the right key. In each session, cumulated pecks initially has a slope appropriate to the prior condition and then switches abruptly to a slope in the same direction as the cumulated food.
Fig 12
Fig 12
Within-component choice, calculated for each interfood interval, from one condition of the experiment reported by Baum and Davison (2004). Top: As more food deliveries occur, choice moves from indifference toward a level appropriate to the food ratio in the component. Bottom: Log behavior ratio (last three points in the upper graph) plotted against log obtained food ratio across the seven components. The regression line fits the points closely but shows considerable undermatching at the end of the components.
Fig 13
Fig 13
Choice dynamics following food delivery in the Baum and Davison (2004) experiment. Top: Peck-by-peck choice following the beginning of the component (diamonds) and following one (triangles) or two (squares) food deliveries from the left key (filled symbols) or the right key (unfilled symbols). The first point represents all first pecks, the second point pecks 2 and 3, the third point pecks 4–7, the fourth point pecks 8–15, the fifth point pecks 16–31, and the last point all pecks beyond 32. Preference pulses appear following one or two food deliveries. Bottom: Log food ratio calculated from the occurrences of the next food following the beginning of the component (diamonds) or one or two food deliveries from the left or right key (same legend as the top graph). Food produced by each peck grouping on the horizontal axis was summed for the left and right keys and the ratio calculated. If food occurred again soon, it tended to be more often from the same key.
Fig 14
Fig 14
Choice tracking relative food in the Baum and Davison (2004) experiment. The log behavior ratios from Figure 13 plotted against the log food ratios. The regression line indicates that choice tended to match relative food but with considerable undermatching. This result may be interpreted as an example of self-similarity across time scales.
Fig 15
Fig 15
Visits or bouts within components in the Baum and Davison (2004) experiment. Triangles show the first visit at a key following a series of 1 to 11 food deliveries from that same key (continuations). The lines extending down from the triangles show visits following that visit, alternating between the not-just-productive key and the just-productive key. A dynamic pattern of long visit followed by shorter alternating visits appears following the first food delivery and becomes more pronounced with further continuations. The line beginning with a diamond at zero on the x-axis shows the pattern in visits before any food when visits are calculated from the first key pecked. The squares show the first visit following a food delivery from the other key—a discontinuation. The dynamic pattern is apparent only at first, when only one food delivery preceded the switch of key; when preceded by more than one continuation, the postfood visit is relatively short, and the postchangeover visits at both keys are shorter still, indicating rapid alternation. These dynamics present an example of reduction at a small time scale.
Fig 16
Fig 16
An approximation to a preference pulse derived from a simple model of the switching dynamics shown in Figure 15. The preference pulse, and hence matching, can be derived from the switching dynamics, but not the other way around.

References

    1. Aparicio C.F, Baum W.M. Fix and sample with rats in the dynamics of choice. Journal of the Experimental Analysis of Behavior. 2006;86:43–63. - PMC - PubMed
    1. Aparicio C.F, Baum W.M. Dynamics of choice: Relative rate and amount affect local preference at three different time scales. Journal of the Experimental Analysis of Behavior. 2009;91:293–317. - PMC - PubMed
    1. Banna K.M, Newland M.C. Within-session transitions in choice: A structural and quantitative analysis. Journal of the Experimental Analysis of Behavior. 2009;91:319–335. - PMC - PubMed
    1. Baum W.M. The correlation-based law of effect. Journal of the Experimental Analysis of Behavior. 1973;20:137–153. - PMC - PubMed
    1. Baum W.M. On two types of deviation from the matching law: Bias and undermatching. Journal of the Experimental Analysis of Behavior. 1974;22:231–242. - PMC - PubMed

LinkOut - more resources