. 2011 Jun 1;519(8):1476-91.
doi: 10.1002/cne.22577.

Neurogliaform cells in the molecular layer of the dentate gyrus as feed-forward γ-aminobutyric acidergic modulators of entorhinal-hippocampal interplay

Affiliations

Neurogliaform cells in the molecular layer of the dentate gyrus as feed-forward γ-aminobutyric acidergic modulators of entorhinal-hippocampal interplay

Caren Armstrong et al. J Comp Neurol. .

Abstract

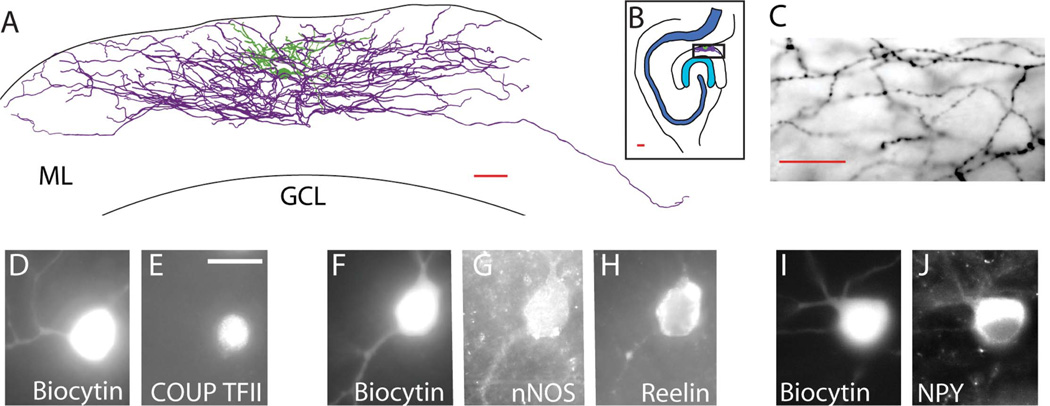
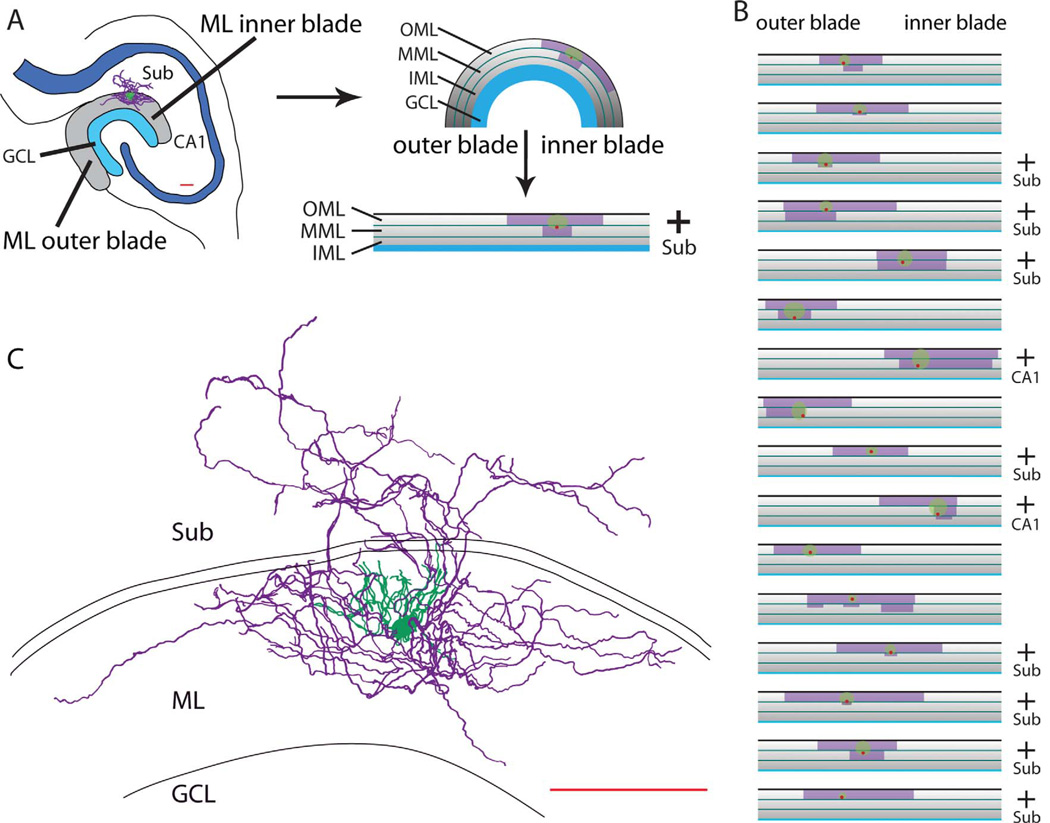
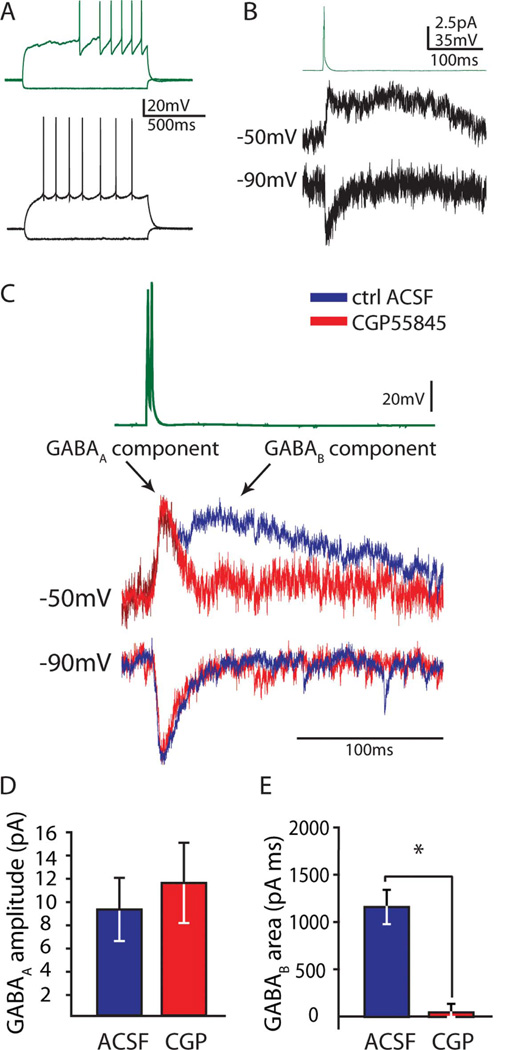
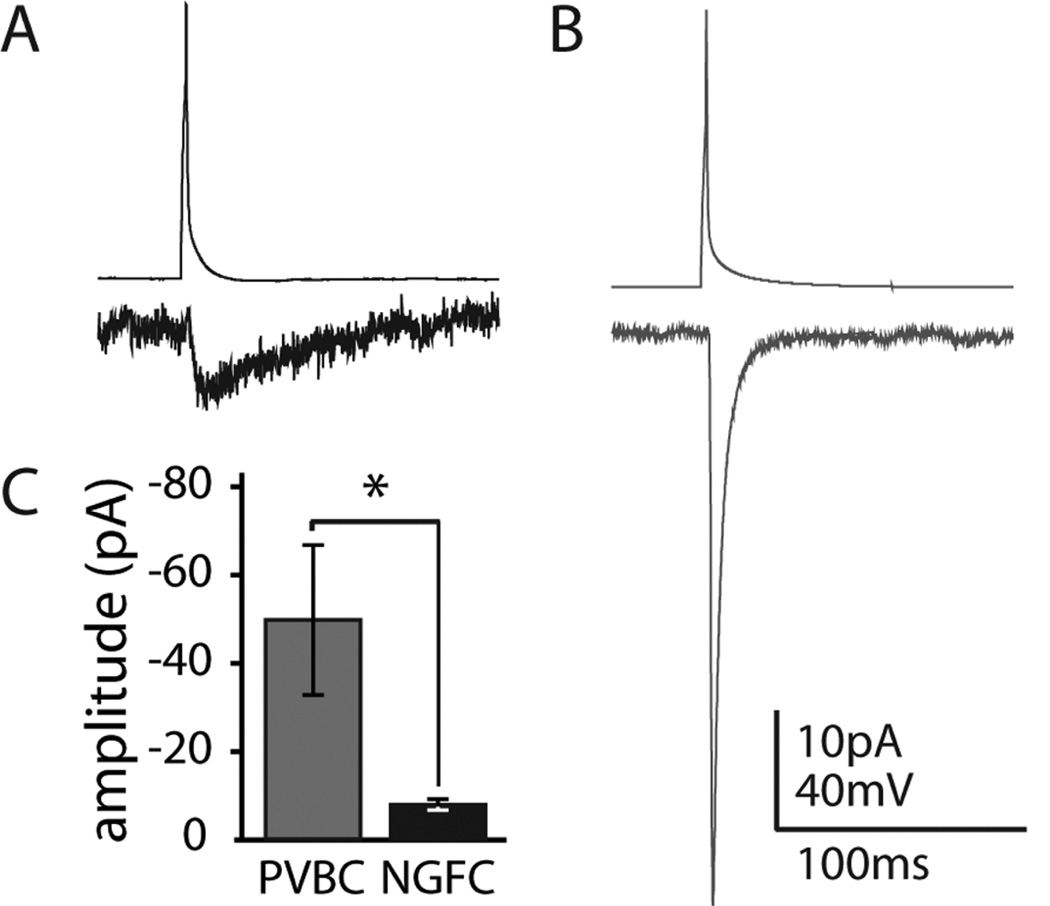
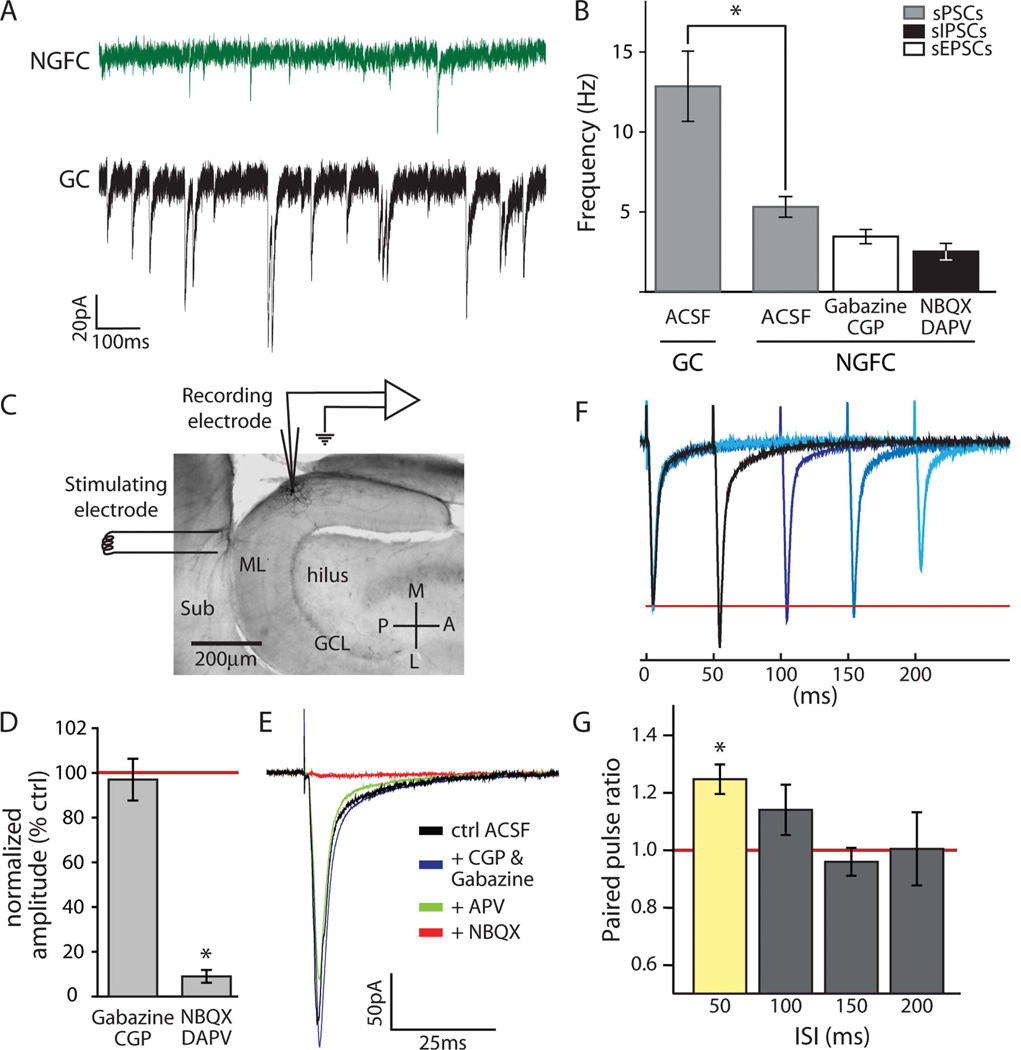
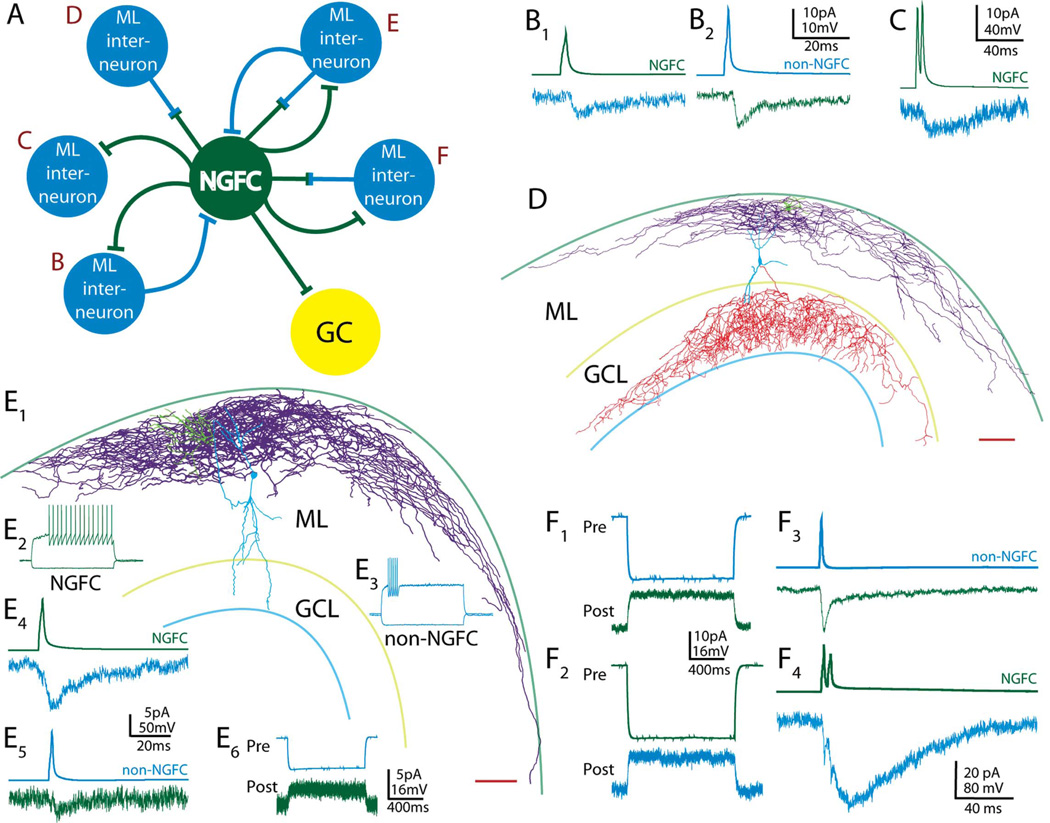
Feed-forward inhibition from molecular layer interneurons onto granule cells (GCs) in the dentate gyrus is thought to have major effects regulating entorhinal-hippocampal interactions, but the precise identity, properties, and functional connectivity of the GABAergic cells in the molecular layer are not well understood. We used single and paired intracellular patch clamp recordings from post-hoc-identified cells in acute rat hippocampal slices and identified a subpopulation of molecular layer interneurons that expressed immunocytochemical markers present in members of the neurogliaform cell (NGFC) class. Single NGFCs displayed small dendritic trees, and their characteristically dense axonal arborizations covered significant portions of the outer and middle one-thirds of the molecular layer, with frequent axonal projections across the fissure into the CA1 and subicular regions. Typical NGFCs exhibited a late firing pattern with a ramp in membrane potential prior to firing action potentials, and single spikes in NGFCs evoked biphasic, prolonged GABA(A) and GABA(B) postsynaptic responses in GCs. In addition to providing dendritic GABAergic inputs to GCs, NGFCs also formed chemical synapses and gap junctions with various molecular layer interneurons, including other NGFCs. NGFCs received low-frequency spontaneous synaptic events, and stimulation of perforant path fibers revealed direct, facilitating synaptic inputs from the entorhinal cortex. Taken together, these results indicate that NGFCs form an integral part of the local molecular layer microcircuitry generating feed-forward inhibition and provide a direct GABAergic pathway linking the dentate gyrus to the CA1 and subicular regions through the hippocampal fissure.


Figures

Figure 1
Figure 1
Characteristic morphologies and immunocytochemical profiles of NGFCs in the dentate. A: Camera lucida drawing from a representative 100-µm section of a dentate NGFC. B: Position of the cell shown in A within the horizontal hippocampal section. ML, molecular layer; GCL, granule cell layer. C: Light microscopic view (×100) of the characteristic axonal arborization of the cell shown in A showing multiple axonal branches passing through a single plane of focus and frequent, small en passant boutons. D–J: Recorded and confirmed NGFCs in the dentate filled with biocytin (×100) express a variety of NGFC markers, including COUP TFII (D,E), nNOS (F,G), and reelin (G), and NPY (H–J). Each image represents a single fluorescent channel, with biocytin indicating the recorded cell (D,F,I) and the adjacent panels indicating individual antibody labeling in the same plane of focus (E,G,H,J). The brightness and contrast of these images were digitally adjusted to provide maximal visualization of the markers. Scale bars = 20 µm. [Color figure can be viewed in the online issue, which is available at wileyonlinelibrary.com.]
Figure 2
Figure 2
Extent of dentate NGFCs within and beyond the molecular layer. A: Example of a subiculum-projecting NGFC (reconstructed in C), in which the locations of the soma, dendritic tree, and axonal arbor were measured and plotted onto an arc of the molecular layer (ML). The arc was flattened and divided into outer (O; top), middle (M), and inner (I; bottom) layers to produce an overview map of single NGFCs: locations of cell bodies (red dots; n = 8 in MML, n = 9 in OML), dendritic fields (green circles), and axonal clouds (purple boxes). Sub, subiculum; GCL, granule cell layer. The presence of axons within the subiculum is indicated by a plus sign to the right of the map. B: Plots of 16 additional NGFCs in the dentate, constructed as shown in A. The axonal arbors covered, on average, 37.7% ± 7.5% of the total length of the molecular layer, which was, on average, 1, 122.9 ± 3.9 µm in length. Note that 11 of the 17 measured cells had axons projecting across the hippocampal fissure into the subiculum or CA1 regions (indicated by a plus sign to the right of the map). C: Camera lucida reconstruction of the subiculum-projecting NGFC mapped in A. Soma and dendrites are in green, axon in purple. Scale bars = 100 µm.
Figure 3
Figure 3
NGFC output to GCs. A: Characteristic firing patterns of a dentate NGFC (top traces) and GC (bottom traces) showing the NGFC’s slight depolarizing ramp with late firing and unique afterhyperpolarization shape. B: Average postsynaptic current responses in granule cells voltage clamped at −50 mV (middle trace, n = 9 pairs) or −90 mV (bottom trace, n = 7 pairs) following a single action potential in presynaptic NGFCs (top trace). Note that the early ionotropic GABAA component is outward at −50 mV and inward at −90 mV and that the slow metabotropic GABAB component is not visible at −90 mV, close to its reversal potential. C: The late GABAB component can be abolished by the GABAB antagonist CGP55845, as demonstrated in averaged traces (n = 3 pairs), normalized to control GABAA peak (traces organized as in B). D,E: The GABAB antagonist CGP55845 has no effect on the amplitude of GABAA currents (P = 0.16), but the GABAB component of the postsynaptic response (measured as area under the GABAB curve after the GABAA response has returned to baseline) is abolished by the CGP55845 (*P = 0.02). [Color figure can be viewed in the online issue, which is available at wileyonlinelibrary.com.]
Figure 4
Figure 4
NGFC vs. PVBC responses in GCs. Average currents in GCs held in voltage clamp at −90 mV (bottom traces) elicited by a single action potential (top traces) in NGFCs (n = 7 pairs; A) or PVBCs (n = 5 pairs; B) demonstrate the significant difference in the amplitude of the responses measured at the GC soma (*P = 0.01; C). Note that, because of the prolonged nature of the response to NGFCs, the inhibitory charge transfer, as measured by the area under the response at −90 mV, is comparable (see text; P = 0.30).
Figure 5
Figure 5
Inputs to dentate NGFCs. A: Example traces of sPSCs in an NGFC (top trace) and a GC (bottom trace). B: Quantification of sPSCs in GCs (n = 6) and NGFCs (n = 6), demonstrating that NGFCs receive significantly fewer spontaneous inputs than GCs (*P < 0.01). sPSCs were further separated into excitatory (EPSC; n = 6; 3.6 ± 0.5 Hz) and inhibitory (IPSC; n = 4; 2.6 ± 0.5 Hz) events using the GABA antagonists CGP55845 and gabazine or the glutamate receptor antagonists NBQX and D-APV, respectively. C: Experimental setup for field stimulation experiments. A stimulating electrode was placed on the subicular side (Sub) of the hippocampal fissure to stimulate the perforant path, and a patch pipette was used to record responses in molecular layer (ML) NGFCs. GCL, granule cell layer; P, posterior; A, anterior; M, medial; L, lateral. D,E: An inward current mediated primarily by AMPA channels was observed in NGFCs in response to perforant path stimulation. Specific antagonists were bath applied sequentially, beginning with GABA antagonists CGP55845 and gabazine, followed by the NMDA antagonist D-APV, and finally by the AMPA antagonist NBQX. Quantification (D) and an example (E) of wash-in data are presented. D: Quantified data were normalized to response amplitudes in normal ACSF. Perforant path input was not blocked by GABA antagonists (CGP55845 and gabazine; n = 8; P = 0.49) but was abolished by glutamate antagonists (NBQX and D-APV; n = 10; *P < 0.01). E: In the example traces, the stimulation artifact (truncated) is followed by an inward current that persisted in GABA and NMDA antagonists but was abolished by the AMPA antagonist NBQX. F,G: Perforant path input exhibits facilitation at 50 msec, but not longer interstimulus intervals (ISIs). Paired-pulse ratio was expressed as the second peak:first peak amplitude. F: Example traces are averaged responses in a single NGFC to paired pulses of varying ISIs (overlaid). G: Quantification of paired perforant path stimulation reveals a significant facilitation at 50 msec ISI (n = 5; *P < 0.01) but not at 100 (n = 5, P = 0.17), 150 (n = 5, P = 0.54), or 200 msec (n = 5; P = 0.93) ISIs. Scale bar = 200 µm. [Color figure can be viewed in the online issue, which is available at wileyonlinelibrary.com.]
Figure 6
Figure 6
Specific examples of the diverse interneuronal connections of NGFCs. A: Several different connectivity motifs were observed between NGFCs and other molecular layer (ML) interneurons, either other NGFCs or non-NGFCs. In each case, at least one cell of the pair (in each case, shown in dark green) could be positively identified as an NGFC. Each observed motif is lettered B–F, and B–F represent examples corresponding to these letters. The numbers of observations of each motif were as follows: B, n = 2; C, n = 1; D, n = 4; E, n = 1; F, n = 3. B: Bidirectional synaptic connection from NGFC to non-NGFC (B1) and non-NGFC to NGFC (B2). C: Unidirectional NGFC to molecular layer interneuron synaptic connection. D: Camera lucida reconstruction of an electrically connected NGFC to non-NGFC pair (0.6% coupling coefficient, electrophysiology not shown), demonstrating heterologous electrical coupling between two distinct cell types. NGFC soma and dendrites are in green, NGFC axon in purple, non-NGFC soma and dendrites in blue, and non-NGFC axon in red. Reference lines represent the outer edge of the molecular layer and the borders of the granule cell layer (GCL). E: Camera lucida reconstruction (E1) and electrophysiology (E2–6) from an electrically and synaptically connected NGFC to non-NGFC pair (color scheme and scale bar as in D, non-NGFC axon not recovered). Electrophysiology: firing pattern of NGFC (E2; dark green, left) and non-NGFC (E3; light blue, right); NGFC (green; E4) to non-NGFC (blue) chemical synaptic connection; non-NGFC to NGFC chemical synaptic connection (E5) and electrical connection (E6); electrical connections revealed by injecting a −100-pA hyperpolarizing current into one presynaptic (Pre) cell (top, blue) and observing an outward current in a postsynaptic (Post) cell (bottom) held in voltage clamp at −75 mV. Electrical coupling coefficient for this pair was 2.3% (see text). F: Example of a NGFC to non-NGFC pair with an electrical coupling coefficient of 7.8% and a unidirectional chemical synaptic connection. The electrical connection was revealed bidirectionally (F1,2) as described for E. For chemical synaptic connections (F3,4) single or dual action potentials were elicited in the presynaptic cell (upper traces), eliciting (lower traces) an electrically mediated response in the postsynaptic NGFC (F3; green), and both an electrically and chemical synaptically mediated current in the postsynaptic non-NGFC (F4; blue). Note that, in this pair, the difference between electrical and chemical synaptic currents can be clearly seen as two nearly instant peaks representing the electrical connection riding on the rise of the delayed, larger amplitude chemical synaptic current. Scale bars = 100 µm.

Similar articles

Cited by

References

    1. Acsady L, Kamondi A, Sik A, Freund T, Buzsaki G. GABAergic cells are the major postsynaptic targets of mossy fibers in the rat hippocampus. J Neurosci. 1998;18:3386–3403. - PMC - PubMed
    1. Alle H, Jonas P, Geiger JR. PTP and LTP at a hippocampal mossy fiber-interneuron synapse. Proc Natl Acad Sci U S A. 2001;98:14708–14713. - PMC - PubMed
    1. Amaral DG, Scharfman HE, Lavenex P. The dentate gyrus: fundamental neuroanatomical organization (dentate gyrus for dummies) Prog Brain Res. 2007;163:3–22. - PMC - PubMed
    1. Amitai Y, Gibson JR, Beierlein M, Patrick SL, Ho AM, Connors BW, Golomb D. The spatial dimensions of electrically coupled networks of interneurons in the neocortex. J Neurosci. 2002;22:4142–4152. - PMC - PubMed
    1. Andersen P, Holmqvist B, Voorhoeve PE. Entorhinal activation of dentate granule cells. Acta Physiol Scand. 1966;66:448–460. - PubMed

Publication types

Substances