. 2011 Jun 1;519(8):1616-29.
doi: 10.1002/cne.22589.

Mutually exclusive expression of Gαia and Gα14 reveals diversification of taste receptor cells in zebrafish

Affiliations

Mutually exclusive expression of Gαia and Gα14 reveals diversification of taste receptor cells in zebrafish

Makoto Ohmoto et al. J Comp Neurol. .

Abstract

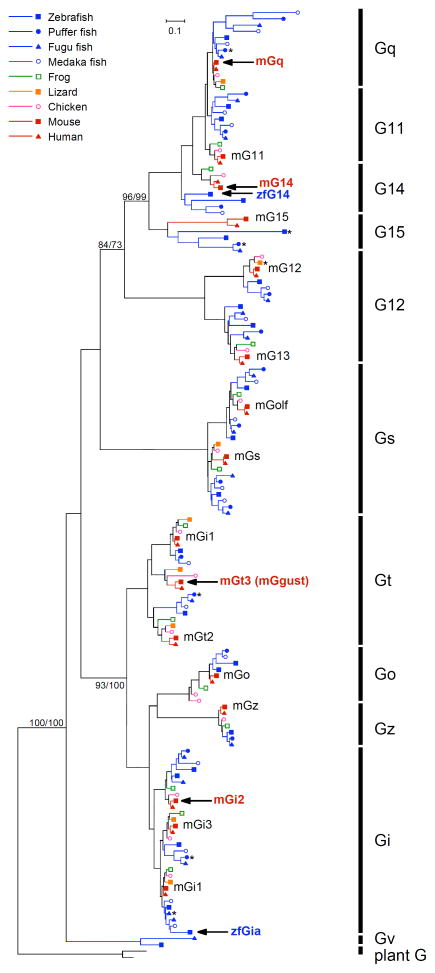
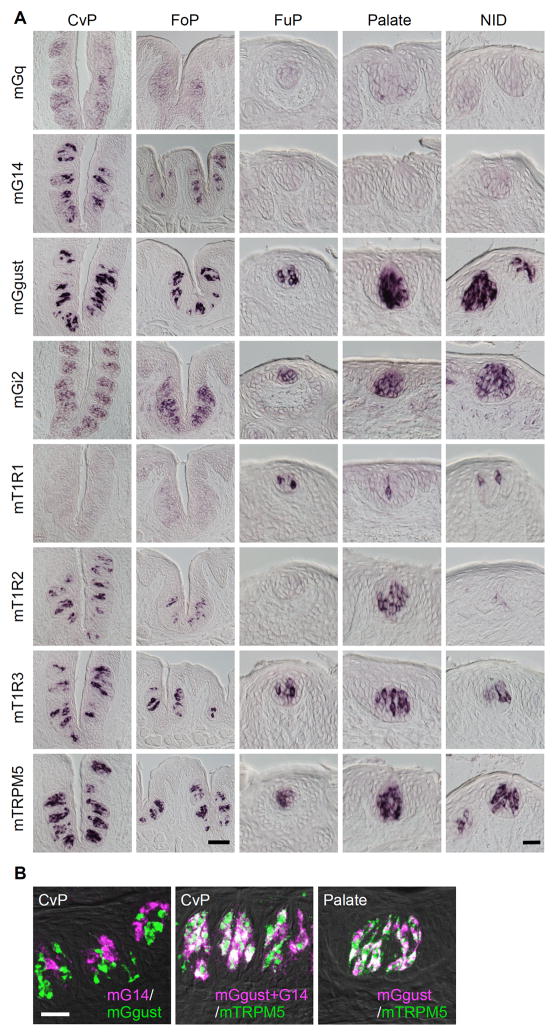
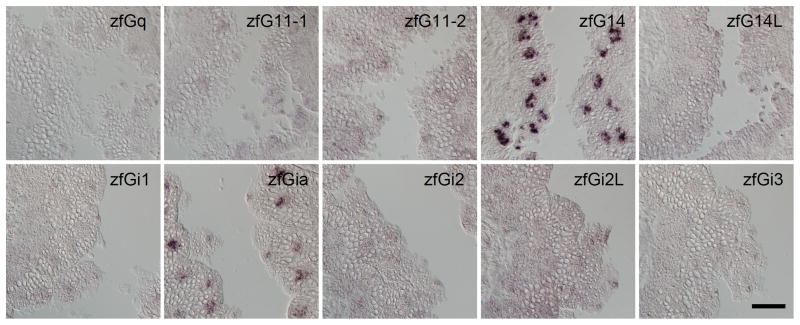
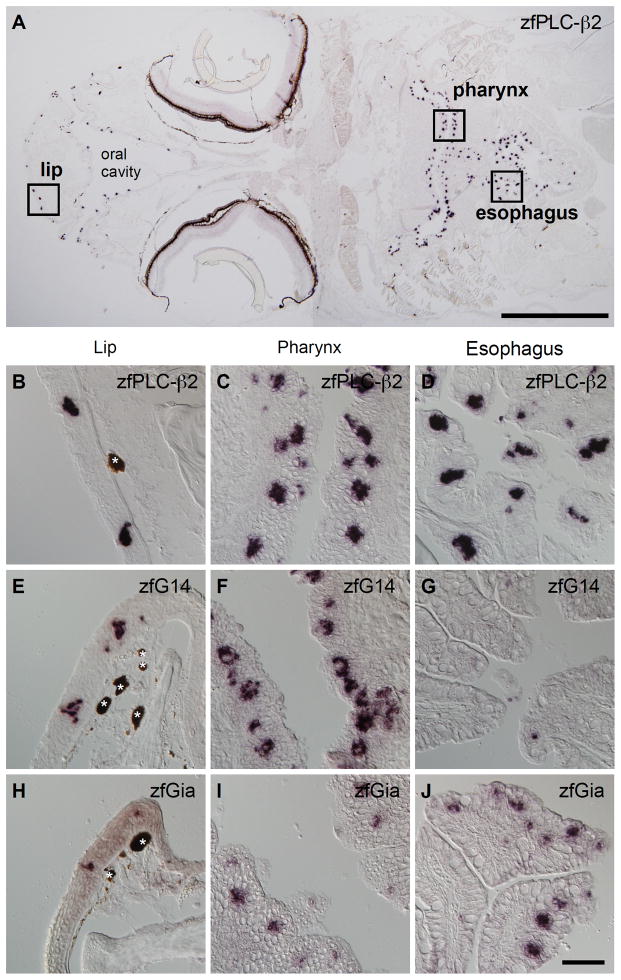
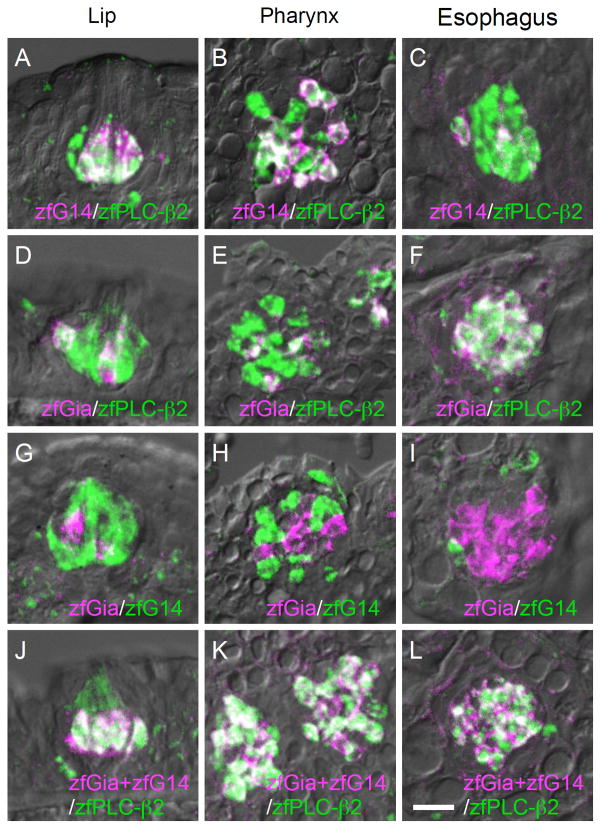
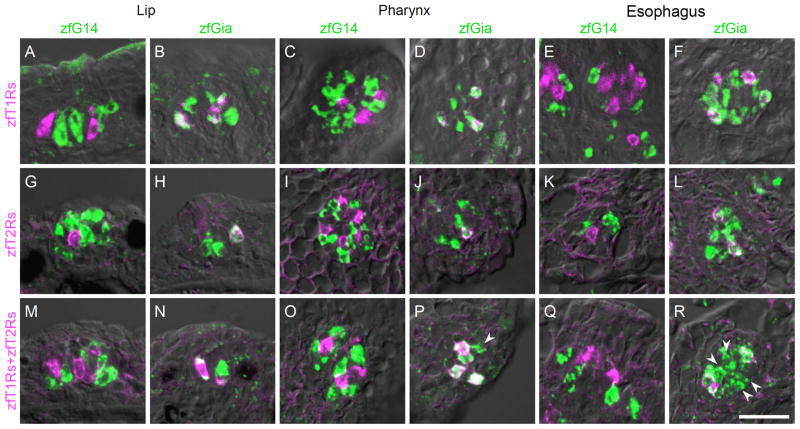
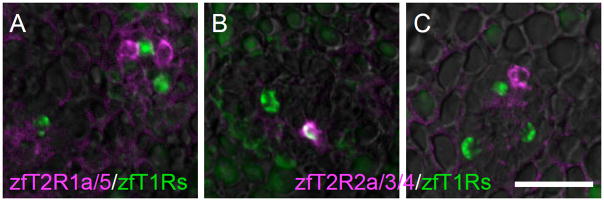
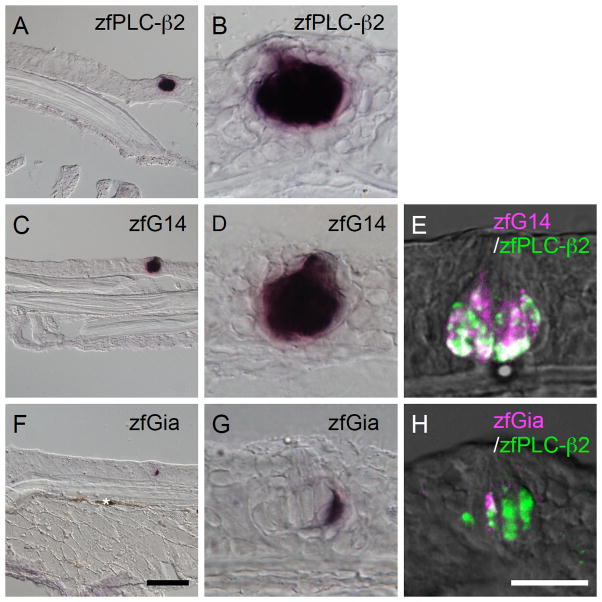
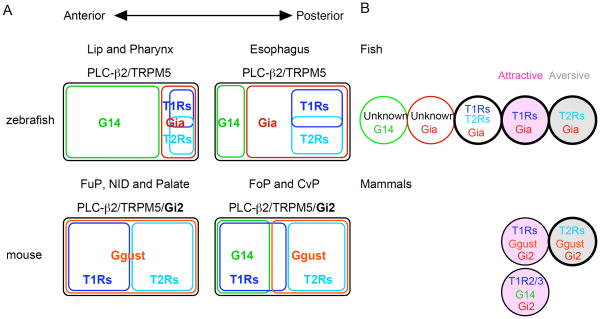
A comprehensive reevaluation of the G protein alpha subunit genes specifically expressed in taste buds in the tongue epithelium of rodents revealed that Gq and G14 of the Gq class and Gi2 and Ggust (Gt3, also known as gustducin) of the Gi class are expressed in mammalian taste buds. Meanwhile, a database search of fish genomes revealed the absence of a gene encoding an ortholog of the mammalian Ggust gene, which mediates sweet, umami, and bitter taste signals in mammalian taste receptor cells (TRCs). Histochemical screening identified two G protein alpha subunit genes, zfGia and zfG14, expressed in subsets of TRCs in zebrafish. The expression patterns of zfGia and zfG14 in taste buds were mutually exclusive, and the expression of known T1R and T2R genes in zebrafish was restricted to a subset of zfGia-expressing TRCs. These findings highlight the existence of a novel subset of TRCs in zebrafish that is absent in mammals and suggest that unidentified G protein-coupled receptors are expressed in zfG14-expressing TRCs and in zfGia-expressing TRCs where known T1R and T2R genes were not expressed in zebrafish. The existence of not only generalized but also specialized subsets of TRCs may imply a strong connection between the evolution of the peripheral gustatory system and the evolution of particular species.


Figures

Fig. 1
Fig. 1. Unrooted phylogenetic trees of G protein alpha subunits in vertebrates constructed by the maximum likelihood (ML) method
Plant G alpha subunits are used as an outgroup. Bootstrap values over 70% calculated by the ML and neighbor-joining (NJ) method for branch support were presented in the order of ML/NJ for the major branch. Mouse and zebrafish G alpha genes expressed in taste receptor cells according to the present study and previous studies are shown in bold red and blue letters, respectively, with black arrows. Asterisks indicate genes that have been pseudogenized by insertion or deletion of a single nucleotide that was followed by a downstream in-frame stop codon.
Fig. 2
Fig. 2. Comprehensive re-evaluation of the taste bud-specific expression of Gq, G14, Ggust, and Gi2 mRNA in mouse oral epithelia
The expression of mouse mRNA was revealed by in situ hybridization. A, The expression of mGq and mG14 was restricted to the taste buds in the posterior gustatory papillae, whereas mGi2 and mGgust were expressed in most taste buds in the oral cavity. mT1R1 and mT1R2 were used as references for region-specific expression. mT1R3 and mTRPM5 were used as references for subset-specific expression in taste buds. CvP, circumvallate papilla; FoP, foliate papilla; FuP, fungiform papilla; NID, nasoincisor duct. Scale bars: CvP and FoP (in the bottom panel of FoP), 50 μm; FuP, Palate, and NID (in the bottom panel of NID), 20 μm. B, Double-labeled fluorescent in situ hybridization was carried out to examine the relationship between the expression patterns of mGgust, mG14, and mTRPM5. Summation of signals of mGgust and mG14 were completely overlapped with the signals of mTRPM5 in the CvP where mG14 was expressed. In the palate where mG14 was not expressed, the signals of mGgust and those of mTRPM5 were completely overlapped. n=2 or 3, number of sections ≥4 for CvP, FoP, and NID, and ≥20 for FuP and Palate. Scale bar: 10 μm.
Fig. 3
Fig. 3. Expression of G protein alpha subunits in zebrafish taste buds
In situ hybridization screening was carried out to identify Gq and Gi species expressed in taste buds in zebrafish. n≥3 (number of sections ≥15) for zfG14 and zfGia, n=2 (no. of sections ≥10) for zfGq, zfG11-1, zfG11-2, and zfG14L, and n=1 (no. of sections ≥5) for zfGi1, zfGi2, zfGi2L, and zfGi3. Scale bar: 50 μm.
Fig. 4
Fig. 4. Spatial distribution of G14 and Gia mRNAs in zebrafish
A–D, Distribution of taste buds marked by zfPLC-β2 expression: a global view of a horizontal head section (A) and magnified images of the lip (B), pharyngeal (C), and esophageal (D) epithelia. E–G, Expression of zfG14 mRNA in the lip (E), pharyngeal (F), and esophageal (G) epithelia. H-J, Expression of zfGia mRNA in the lip (H), pharyngeal (I), and esophageal (J) epithelia. mRNA expression revealed by in situ hybridization is indicated by purple staining. Dark brown matter unrelated to this experiment is indicated by white asterisks. Scale bars: A, 1 mm; B–J (in J), 50 μm.
Fig. 5
Fig. 5. Relationship of intragemmal expression of G14, Gia, and PLC-β2 in zebrafish gustatory epithelia
Double-labeled fluorescent in situ hybridization was carried out to examine the relationship between the expression patterns of the following pairs of genes: zfG14 (magenta) and zfPLC-β2 (green) (A–C), zfGia (magenta) and zfPLC-β2 (green) (D–F), zfGia (magenta) and zfG14 (green) (G–I), and zfG14/zfGia (magenta) and zfPLC-β2 (green) (J–L). Signals for zfG14 and zfGia were included in those for zfPLC-β2 (A–F). Signals for zfG14 and zfGia did not overlap (G–I), and their summation was identical to the signal for zfPLC-β2 (J–L), quite similar to the case in mice (Fig. 2B). n=2, number of sections ≥10 for each examination. Scale bars: A–L (in L), 20 μm; M–O (in M), 10 μm.
Fig. 6
Fig. 6. Molecular characterization of taste receptor cells expressing G14 and Gia in zebrafish gustatory epithelia
Double-labeled fluorescent in situ hybridization was carried out to examine the relationship between the expression of G alpha subunits and the expression of known taste receptors. The probe for zfT1Rs was a mixture of zfT1R2a, zfT1R2b and zfT1R3 riboprobes, which covers all known T1R-expressing TRCs in zebrafish (Ishimaru et al., 2005). The probe for zfT2Rs was also a mixture of zfT2R1a, zfT2R2a, zfT2R3, zfT2R4, and zfT2R5 riboprobes, which covers all known T2R-expressing TRCs in zebrafish (Ishimaru et al., 2005; Oike et al., 2007; Okada et al., 2010). The probe for zfT1Rs+zfT2Rs was a further mixture of the probes for zfT1Rs and zfT2Rs. G14, Gia, and zfT1Rs (A–F); G14, Gia, and zfT2Rs (G–L); and G14, Gia, and all known zebrafish taste receptors (M–R). Both zfT1Rs and zfT2Rs were co-expressed with zfGia (A–L). White arrowheads indicate zfGia-expressing cells that lack zfT1R and zfT2R expression (P and R). n≥2, number of sections ≥10 for each examination. Scale bar: A–R (in R), 20 μm.
Fig. 7
Fig. 7. Absence of expression of olfactory GPCRs in zebrafish taste buds
In situ hybridization screening was carried out to examine the expression of GPCRs in taste buds (A–D) that are known as chemoreceptors expressed in olfactory sensory neurons in zebrafish and/or mammals. Mixed probes for OR111-1, OR111-2, OR111-3, OR111-5, OR111-7, and OR111-10 (A and E); mixed probes for OlfCc1, OlfCd2, and OlfCd3 (previously known as VR5.3, VR3.13b, VR3.13a, respectively) (Sato et al., 2005) (B and F); probe for zfTaar9 (C and G); and mixed probes for zfV1R1 and zfV1R2 (D and H) were used. No GPCR species were expressed in taste buds (A–D), but all probes used yielded strong signals in olfactory epithelium in zebrafish (E–H). n=1, number of sections ≥5 for each examination. Scale bar: 50 μm.
Fig. 8
Fig. 8. Relationship of expression of T1Rs and T2Rs in zebrafish taste buds
Double-labeled fluorescent in situ hybridization was carried out to examine the relationship between the expression patterns of zfT2Rs (magenta) and zfT1Rs (green). The probe for zfT1Rs was a mixture of zfT1R2a, zfT1R2b and zfT1R3 riboprobes, which covers all known T1R-expressing TRCs in zebrafish as described in the legend of Fig. 7. The pattern obtained with the probe mixture for zfT2R1a and zfT2R5 did not overlap with the expression pattern of zfT1Rs (A), consistent with our previous data (Ishimaru et al., 2005; Oike et al., 2007). The probe mixture for zfT2R2a, zfT2R3, and zfT2R4 showed both overlapping expression (B) and distinct expression (C) compared with zfT1Rs expression. n=2, number of sections ≥10 for each examination. Scale bars: 20 μm.
Fig. 9
Fig. 9. Expression of G14 and Gia in epithelial cells of the body surface in zebrafish
Single- (A–D, F, and G) and double-label (E and H) in situ hybridization was carried out to examine the expression of G14 and Gia in the epithelial cells of zebrafish. B, D, and G show magnified images of the region with signals in A, C, and F, respectively. The signals of zfPLC-β2 mRNAs were clustered (A and B). The signals of G14 and Gia mRNAs were observed in the clustered zfPLC-β2-expressing cells (E and H). Dark brown matter unrelated to this experiment is indicated by white asterisk. n≥3 (number of sections ≥15) for single-label experiments, n=2 (no. of sections ≥10) for double-label experiments. Scale bars: A, C, and F (in F), 50 μm; B, D, E, G, and H (in H), 20 μm.
Fig. 10
Fig. 10. Schematic comparison of PLC-β2/TRPM5-expressing taste receptor cells between zebrafish and mouse
A, Schematic representation of the expression correlation of G alpha and taste receptor genes and their spatial differences in TRCs expressing both PLC-β2 and TRPM5. Co-expression of Gi2 in these TRCs in mammals is shown in bold above the schemes. B, Schematic representation of the variation in TRCs expressing both PLC-β2 and TRPM5. TRCs are depicted as circles, and the G alpha subunits and taste receptors expressed within them are indicated. T1Rs-and T2Rs-expressing TRCs related to attractive and aversive behaviors are shown in pink and gray, respectively. Bold circles indicate greater variety due to the expression profiles of T1Rs in fish and T2Rs in human. Newly identified subsets of TRCs in fish likely express GPCRs other than the currently known chemosensory receptors, including V2Rs, V1Rs, ORs, TAARs, and ORAs which are expressed in olfactory receptor neurons.

Similar articles

Cited by

References

    1. Adler E, Hoon MA, Mueller KL, Chandrashekar J, Ryba NJP, Zuker CS. A novel family of mammalian taste receptors. Cell. 2000;100:693–702. - PubMed
    1. Asano-Miyoshi M, Abe K, Emori Y. Co-expression of calcium signaling components in vertebrate taste bud cells. Neurosci Lett. 2000;283:61–64. - PubMed
    1. Barlow LA, Northcutt RG. Embryonic origin of amphibian taste buds. Dev Biol. 1995;169:273–285. - PubMed
    1. Behrens M, Foerster S, Staehler F, Raguse J-D, Meyerhof W. Gustatory expression pattern of the human TAS2R bitter receptor gene family reveals a heterogenous population of bitter responsive taste receptor cells. J Neurosci. 2007;27:12630–12640. - PMC - PubMed
    1. Camps M, Carozzi A, Schnabel P, Scheer A, Parker PJ, Gierschik P. Isozyme-selective stimulation of phospholipase C-β2 by G protein βγ subunits. Nature. 1992;360:684–686. - PubMed

Publication types

MeSH terms

Substances