. 2011 Jun 1;519(8):1455-75.
doi: 10.1002/cne.22576.

Synaptic proteins are tonotopically graded in postnatal and adult type I and type II spiral ganglion neurons

Affiliations

Synaptic proteins are tonotopically graded in postnatal and adult type I and type II spiral ganglion neurons

Jacqueline Flores-Otero et al. J Comp Neurol. .

Abstract

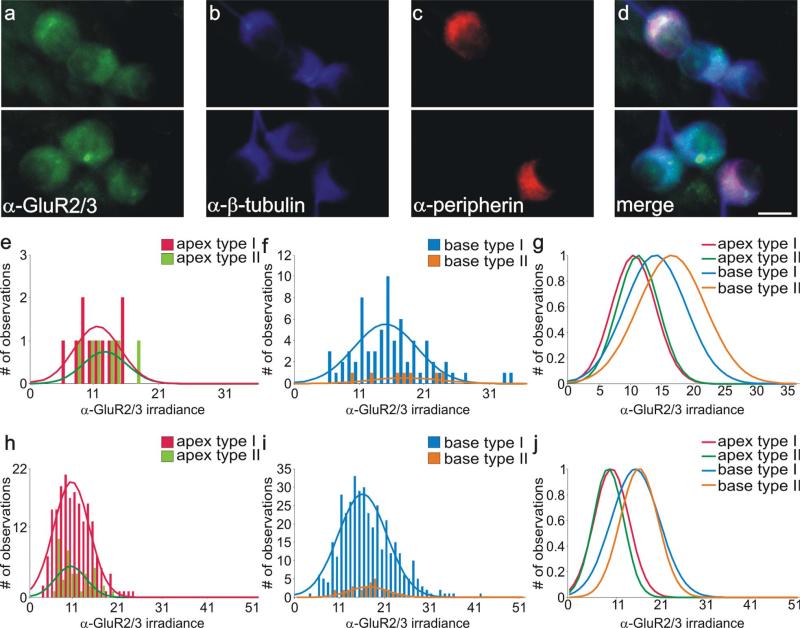
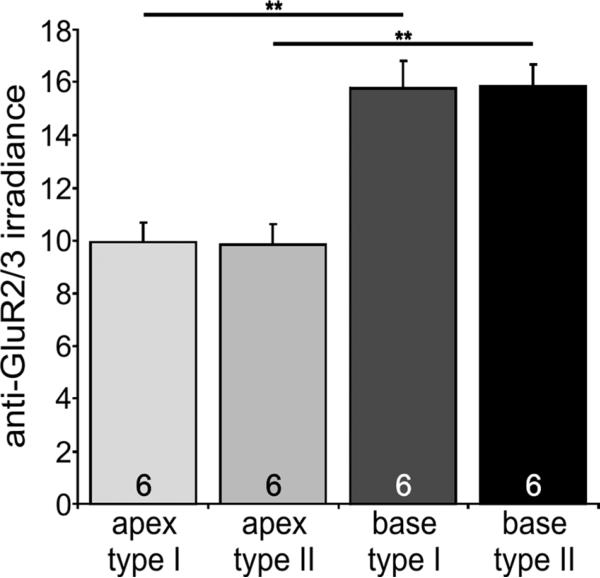
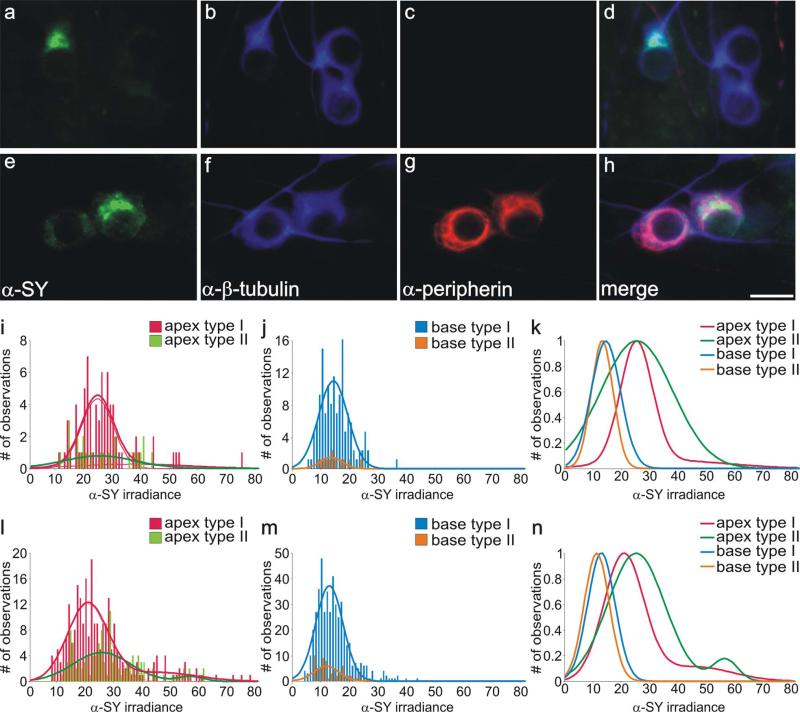
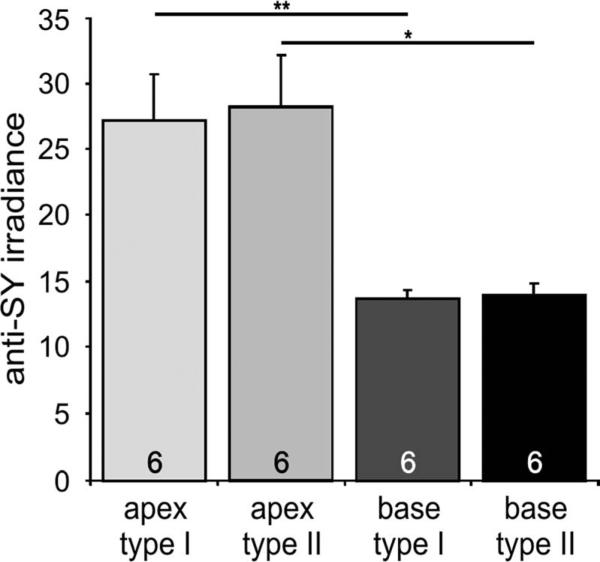
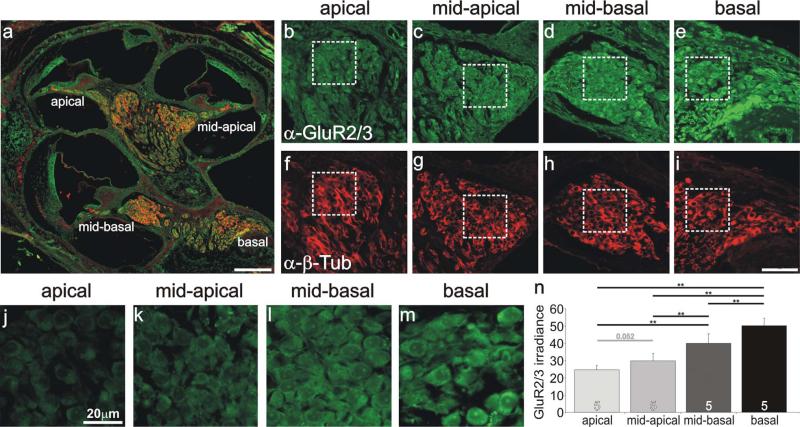
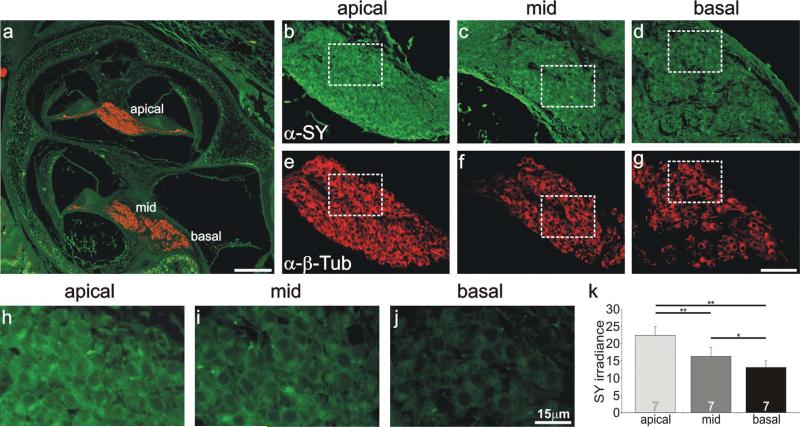
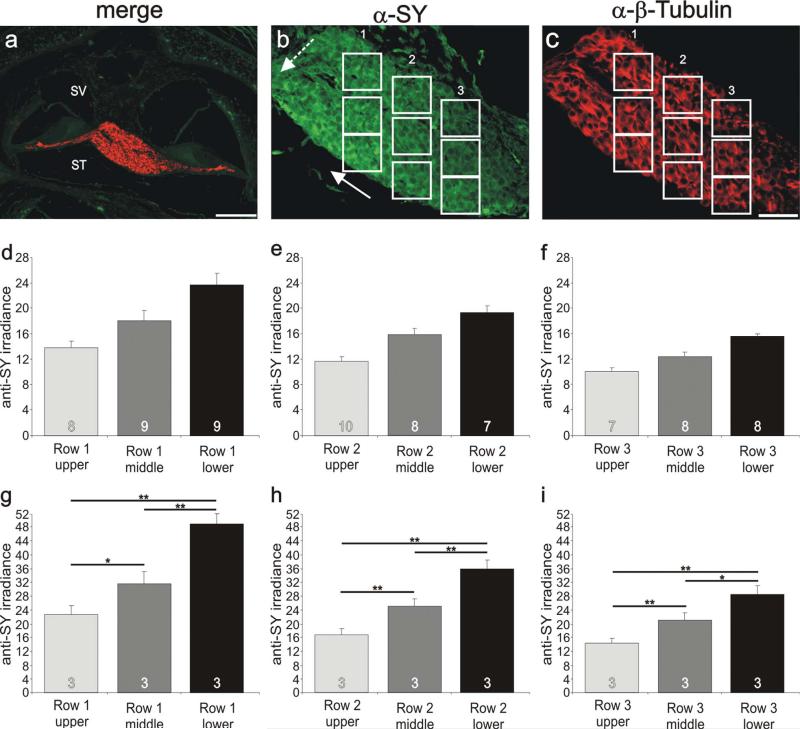
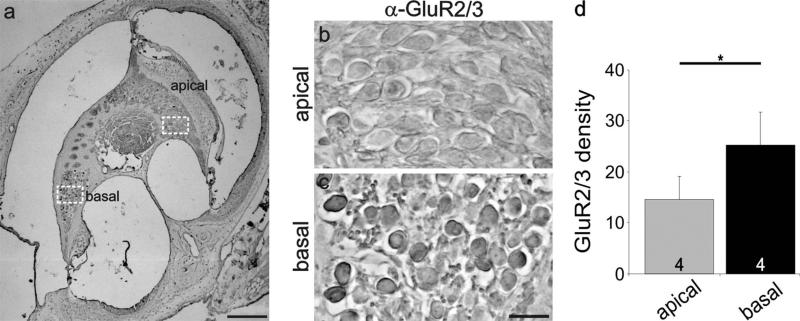
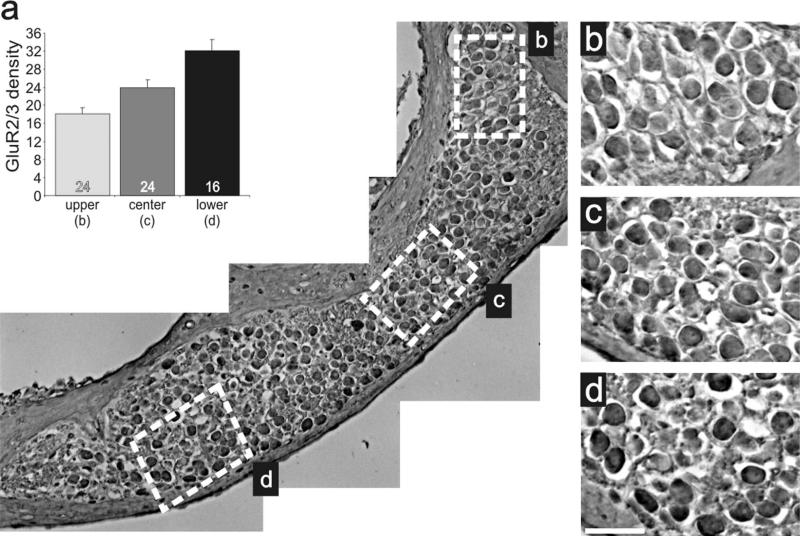
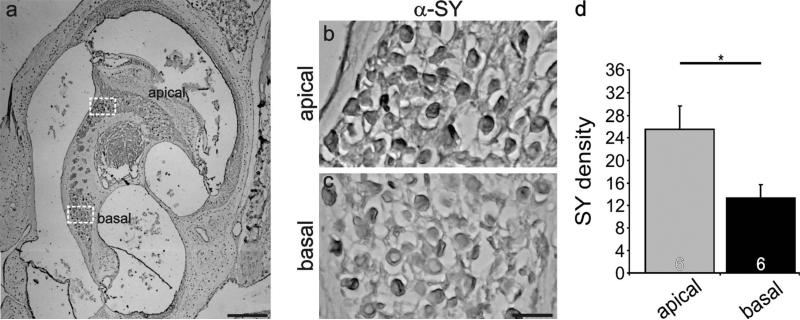
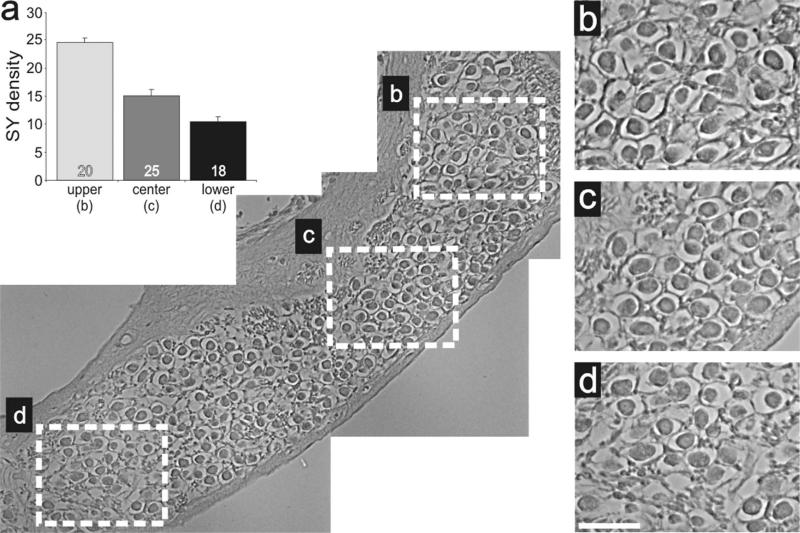
Inherent in the design of the mammalian auditory system is the precision necessary to transduce complex sounds and transmit the resulting electrical signals to higher neural centers. Unique specializations in the organ of Corti are required to make this conversion, such that mechanical and electrical properties of hair cell receptors are tailored to their specific role in signal coding. Electrophysiological and immunocytochemical characterizations have shown that this principle also applies to neurons of the spiral ganglion, as evidenced by distinctly different firing features and synaptic protein distributions of neurons that innervate high- and low-frequency regions of the cochlea. However, understanding the fine structure of how these properties are distributed along the cochlear partition and within the type I and type II classes of spiral ganglion neurons is necessary to appreciate their functional significance fully. To address this issue, we assessed the localization of the postsynaptic AMPA receptor subunits GluR2 and GluR3 and the presynaptic protein synaptophysin by using immunocytochemical labeling in both postnatal and adult tissue. We report that these presynaptic and postsynaptic proteins are distributed oppositely in relation to the tonotopic map and that they are equally distributed in each neuronal class, thus having an overall gradation from one end of the cochlea to the other. For synaptophysin, an additional layer of heterogeneity was superimposed orthogonal to the tonotopic axis. The highest anti-synaptophysin antibody levels were observed within neurons located close to the scala tympani compared with those located close to the scala vestibuli. Furthermore, we noted that the protein distribution patterns observed in postnatal preparations were largely retained in adult tissue sections, indicating that these features characterize spiral ganglion neurons in the fully developed ear.


Figures

Figure 1
Figure 1
Type I and type II spiral ganglion neurons in vitro were immunolabeled similarly with anti-GluR2/3 antibody. a: Two different fields from the same culture dish show that basal type I and type II spiral ganglion neurons in vitro were comparably stained with anti-GluR2/3 antibody (green). b: Both types of spiral ganglion neurons were also stained similarly with anti-β-tubulin antibody (blue). c: Anti-peripherin antibody labeling of presumptive type II neurons (red). d: Merged image of neurons in a and b show that, although clusters of neurons contained both putative type I and type II neurons, there were no significant differences in their staining patterns with anti-GluR2/3 and anti-β-tubulin antibodies. e,f: Frequency histograms of anti-GluR2/3 antibody irradiance measurements from a single experiment; apical type I and type II neurons and basal type I and type II neurons were all well fitted with single Gaussians. g: Normalized Gaussian fits for histograms in e and f show that average irradiance levels of both basal type I and type II neurons are greater than those obtained from both classes of apical neuron. h,i: Frequency histograms composed of anti-GluR2/3 antibody irradiance measurements from six experiments; apical type I and type II neurons and basal type I and type II neurons were well fitted with single Gaussians. j: Normalized Gaussian fits for histograms shown in h and i. Type I and type II distributions were essentially overlapping from each area. As in the single experiment, irradiance levels were consistently highest for both classes of basal neuron. For a magenta-green version see Supporting Information Figure 1. Scale bar = 10 μm.
Figure 2
Figure 2
Quantitative analysis of GluR2/3 enrichment in cultured type I and type II spiral ganglion neurons isolated from the base. An average of six experiments shows that the increased irradiance of basal type I and type II spiral ganglion neurons is statistically significant compared with their apical counterparts. For this figure and subsequent figures, number of experiments is shown in the histogram bars; error bars represent the SEM. Significance of the paired Student's t-test, **P < 0.01.
Figure 3
Figure 3
Type I and type II spiral ganglion neurons isolated in vitro from apical and basal regions showed heterogeneous immunolabeling with anti-synaptophysin antibody. a–d: Apical type I spiral ganglion neurons displayed uniform anti-β-tubulin antibody labeling (b, blue) without anti-peripherin antibody labeling (c, red) and showed heterogeneous anti-synaptophysin labeling when viewed alone (a, green) or when a and b were merged (d). e–h: Apical type II spiral ganglion neurons displayed uniform anti-β-tubulin labeling (f, blue) with robust anti-peripherin antibody labeling (g, red) and showed heterogeneous anti-synaptophysin labeling when viewed alone (e, green) or when e and f were merged (h). i,j: Frequency histograms of anti-synaptophysin antibody irradiance measurements from a single experiment; apical type I and type II neurons and basal type I and type II neurons were all fitted with single Gaussians. k: Normalized Gaussian fits for histograms shown in i and j show that average irradiance levels of both apical type I and type II neurons were greater than those obtained from both classes of basal neurons. l,m: Frequency histograms composed of anti-synaptophysin antibody irradiance measurements from six experiments; apical type I and type II neurons were well fitted with double Gaussians, and basal type I and type II neurons were well fitted with single Gaussians. n: Normalized Gaussian fits for histograms shown in l and m. Within each region, type I and type II distributions were similar, yet irradiance levels of apical neurons were consistently higher than in both classes of basal neuron. For a magenta-green version see Supporting Information Figure 2. Scale bar = 10 μm.
Figure 4
Figure 4
Synaptophysin is enriched in cultured type I and type II spiral ganglion neurons isolated from the apex. An average of six experiment shows that the increased irradiance of apical type I and type II spiral ganglion neurons is statistically significant compared with their basal counterparts. Significance of the paired Student's t-test, *P < 0.05; **P < 0.01.
Figure 5
Figure 5
Inner and outer hair cells located in the basal cochlea had a higher level of anti-BDNF antibody labeling than those located in the apical cochlea. a: Low-magnification view of a postnatal tissue section labeled with anti-BDNF (green) and anti-β-tubulin (red) antibodies. b,c: High-magnification merged images of sensory hair cells outlined in a (white boxes). Regions of measurement are demarcated with a dashed line for inner hair cells and dotted lines for outer hair cells. d: Averages of 15 and 20 measurements (apex and base, respectively) taken from 10 separate sections from three different preparations with two anti-BDNF antibodies showed that irradiance was significantly different between the hair cells from the apical and basal cochlear. Significance of the paired Student's t-test, **P < 0.01. For a magenta-green version see Supporting Information Figure 3. Scale bars = 120 μm in a; 15 μm in c (applies to b,c).
Figure 6
Figure 6
Inner and outer hair cells located in the apical cochlea had a higher level of anti-NT-3 antibody labeling than those located in the basal cochlea. a: Low-magnification view of a postnatal tissue section labeled with anti-NT-3 (green) and anti-β-tubulin (red) antibodies. b,c: High-magnification merged images of sensory hair cells outlined in a (white boxes). Regions of measurement are demarcated with a dashed line for inner hair cells and dotted lines for outer hair cells. d: Averages of seven and 10 measurements (apex and base, respectively) taken from five separate sections from two different preparations showed that irradiance measurements were significantly different between the hair cells from apical and basal cochlear regions. Significance of the paired Student's t-test, **P < 0.01. Asterisks indicate areas between inner and outer hair cells that were not measured. For a magenta-green version see Supporting Information Figure 4. Scale bars = 120 μm in a; 15 μm in c (applies to b,c).
Figure 7
Figure 7
Anti-GluR2/3 antibody labeling of spiral ganglion neurons was systematically graded along the tonotopic axis. a: Low-magnification view of a postnatal cochlear section labeled with anti-GluR2/3 (green) and anti-β-tubulin (red) antibodies, indicating the location of spiral ganglion neurons in different cochlear turns. b–e: Anti-GluR2/3 (green) antibody labeling of spiral ganglion neurons was lowest in apical neurons (b), intermediate in midcochlear regions (c,d), and highest in the most basal region (e). f–i: Spiral ganglion neurons shown in b–e were uniformly labeled with anti-β-tubulin (red). j–m: High-magnification view of neurons outlined with boxes shown in b–e. n: Average values from five experiments confirmed that anti-GluR2/3 irradiance levels were highest in basal neurons and decreased systematically in neurons innervating more apical cochlear regions. Significance of the paired Student's t-test, **P < 0.01. For a magenta-green version see Supporting Information Figure 5. Scale bars = 150 μm in a; 10 μm in i (applies to b–i); 20 μm in j (applies to j–m).
Figure 8
Figure 8
Anti-synaptophysin antibody labeling of spiral ganglion neurons was systematically graded along the tonotopic axis. a: Low-magnification view of a postnatal cochlear section labeled with anti-synaptophysin (green) and anti-β-tubulin (red) indicating the location of spiral ganglion neurons in different cochlear turns. b–d: Anti-synaptophysin (green) antibody labeling of spiral ganglion neurons was highest in apical neurons (b), intermediate in a midcochlear region (c), and lowest in the base (d). e–g: Spiral ganglion neurons shown from b–d, respectively, were uniformly labeled with anti-β-tubulin (red). h–j: High-magnification view of neurons outlined with white boxes shown in b–d. k: Average values from seven experiments confirmed that anti-synaptophysin irradiance levels were highest in apical neurons and decreased systematically in neurons innervating more basal cochlear regions. Significance of the paired Student's t-test, *P < 0.05, **P < 0.01. For a magenta-green version see Supporting Information Figure 6. Scale bars = 150 μm in a; 40 μm in g (applies to b–g); 15 μm in j (applies to h–j).
Figure 9
Figure 9
Local gradients of synaptophysin in postnatal sections are systematically distributed from the scala vestibuli to the scala tympani. a: Low-magnification view of a postnatal cochlear section labeled with anti-synaptophysin (green) and anti-β-tubulin (red) antibodies indicating the location of spiral ganglion neurons in an apical cochlear turn. b: Anti-synaptophysin (green) antibody labeling of spiral ganglion neurons showed two gradients. The first extends from base to apex (solid arrow); the second extends from scala vestibuli to scala tympani (dashed arrow). Therefore, anti-synaptophysin irradiance was highest in the apical neurons closest to the scala tympani (between the two arrowheads). c: Anti-β-tubulin antibody labeling was relatively uniform throughout the region. d: Average anti-synaptophysin antibody irradiance measured from neurons within the upper (SV), middle, and lower (ST) regions shown in b, row 1 (white boxes contain 8, 9, and 9 neurons, respectively). e: Average anti-synaptophysin antibody irradiance measured from neurons within the upper (SV), middle, and lower (ST) regions shown in b, row 2 (white boxes contain 10, 8, and 7 neurons, respectively). f: Average anti-synaptophysin antibody irradiance measured from neurons within the upper (SV), middle, and lower (ST) regions shown in b, row 3 (white boxes contain 7, 8, and 8 neurons, respectively). g–i: Average anti-synaptophysin antibody irradiance from three separate experiments measured from neurons within the upper (SV), middle, and lower (ST) regions. g: Row 1 measurements were made from the most apical region within each section. h: Row 2 measurements were made from the midfrequency region within each section. i: Row 3 measurements were made from the most basal region within each section. SV, scala vestibuli; ST, scala tympani. For a magenta-green version see Supporting Information Figure 7. Significance of the paired Student's t-test, *P < 0.05, **P < 0.01. Scale bars = 15 μm in a; 20 μm in c (applies to b,c).
Figure 10
Figure 10
Differential distribution of anti-GluR2/3 antibody observed postnatally was also present in sections of adult spiral ganglion neurons. a: Low-magnification view of an adult cochlear section labeled with anti-GluR2/3 (brown) antibody indicating the location of spiral ganglion neurons in different cochlear turns. b,c: High-magnification view of apical and basal neurons (white boxes, a) show higher anti-GluR2/3 antibody density levels in basal neurons (c) compared with apical ones (b). d: An average of four experiments confirmed that staining intensity in apical and basal neurons was significantly different. Significance of the paired Student's t-test, *P < 0.05. Scale bars = 200 μm in a; 20 μm in c (applies to b,c).
Figure 11
Figure 11
Anti-GluR2/3 antibody labeling was graded within a localized cochlear region. a: Low-magnification image of adult inner ear tissue labeled with anti-GluR2/3 (brown) antibody sectioned to include an elongated region of neurons that spanned the cochlear contour. Average anti-GluR2/3 antibody density levels measured from neurons within the upper (b, n = 24), center (c, n = 24), and lower (d, n = 16) white boxes. b–d. High-magnification images of neurons demarked by white boxes in a showing the subtle increase in anti-GluR2/3 antibody staining intensity in more basal neurons compared with apical ones within a single cochlear turn. The upper region is apical with respect to the lower region. Scale bar = 25 μm in d (applies to b–d).
Figure 12
Figure 12
Differential distribution of anti-synaptophysin antibody observed postnatally was also present in sections of adult spiral ganglion neurons. a: Low-magnification view of an adult cochlear section labeled with anti-synaptophysin (brown) antibody indicating the location of spiral ganglion neurons in different cochlear turns. b,c: High-magnification view of apical and basal neurons (white boxes, a) illustrating the higher anti-synaptophysin antibody density levels in apical neurons (b) compared with basal ones (c). d: An average of six experiments confirmed that staining intensity in apical and basal neurons was significantly different. Significance of the paired Student's t-test, *P < 0.05. Scale bars = 200 μm in a; 20 μm in c (applies to b,c).
Figure 13
Figure 13
Anti-synaptophysin antibody labeling was graded within a localized cochlear region. a: Low-magnification image of adult inner ear tissue labeled with anti-GluR2/3 (brown) antibody sectioned to include an elongated region of neurons that spanned the cochlear contour. Inset: Average anti-synaptophysin antibody density levels measured from neurons within the upper (b, n = 20), center (c, n = 25), and lower (d, n = 18) white boxes. b–d: High-magnification images of neurons demarked by white boxes in a showing the subtle increase in anti-synaptophysin antibody staining intensity in more apical neurons compared with basal ones within a single cochlear turn. Scale bar = 25 μm in d (applies to b–d).

Similar articles

Cited by

References

    1. Adamson CL, Reid MA, Davis RL. Opposite actions of brain-derived neurotrophic factor and neurotrophin-3 on firing features and ion channel composition of murine spiral ganglion neurons. J Neurosci. 2002a;22:1385–1396. - PMC - PubMed
    1. Adamson CL, Reid MA, Mo ZL, Bowne-English J, Davis RL. Firing features and potassium channel content of murine spiral ganglion neurons vary with cochlear location. J Comp Neurol. 2002b;447:331–350. - PubMed
    1. Benson TE, Brown MC. Postsynaptic targets of type II auditory nerve fibers in the cochlear nucleus. J Assoc Res Otolaryngol. 2004;5:111–125. - PMC - PubMed
    1. Berglund AM, Benson TE, Brown MC. Synapses from labeled type II axons in the mouse cochlear nucleus. Hear Res. 1996;94:31–46. - PubMed
    1. Brown MC, Berglund AM, Kiang NY, Ryugo DK. Central trajectories of type II spiral ganglion neurons. J Comp Neurol. 1988;278:581–590. - PubMed

Publication types