. 2011 Feb;38(2):743-53.
doi: 10.1118/1.3533899.

An anthropomorphic phantom for quantitative evaluation of breast MRI

Affiliations

An anthropomorphic phantom for quantitative evaluation of breast MRI

Melanie Freed et al. Med Phys. 2011 Feb.

Abstract

Purpose: In this study, the authors aim to develop a physical, tissue-mimicking phantom for quantitative evaluation of breast MRI protocols. The objective of this phantom is to address the need for improved standardization in breast MRI and provide a platform for evaluating the influence of image protocol parameters on lesion detection and discrimination. Quantitative comparisons between patient and phantom image properties are presented.

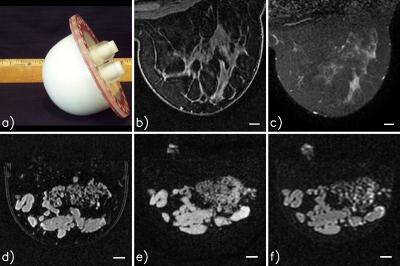
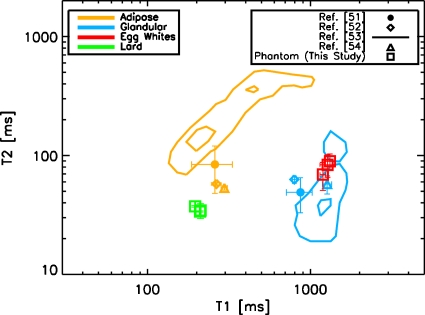
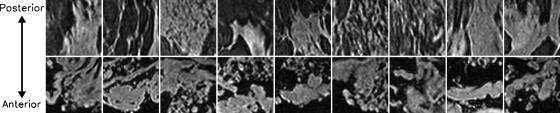
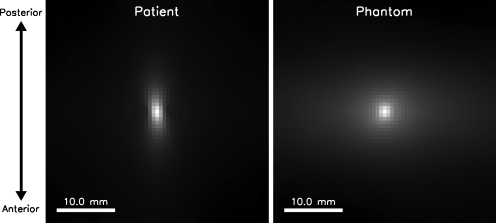
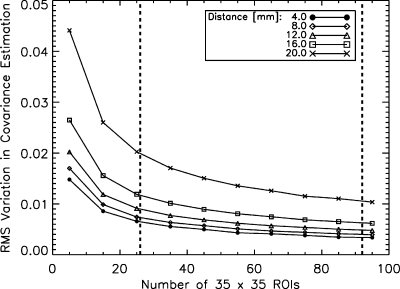
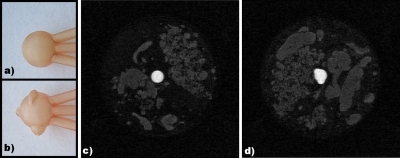
Methods: The phantom is constructed using a mixture of lard and egg whites, resulting in a random structure with separate adipose- and glandular-mimicking components. T1 and T2 relaxation times of the lard and egg components of the phantom were estimated at 1.5 T from inversion recovery and spin-echo scans, respectively, using maximum-likelihood methods. The image structure was examined quantitatively by calculating and comparing spatial covariance matrices of phantom and patient images. A static, enhancing lesion was introduced by creating a hollow mold with stereolithography and filling it with a gadolinium-doped water solution.

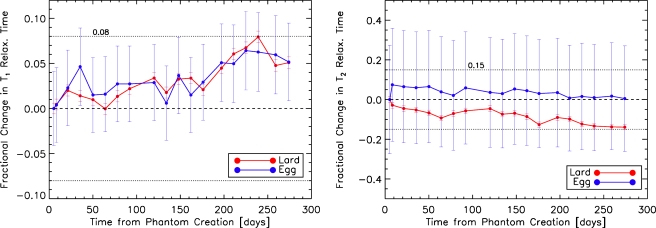
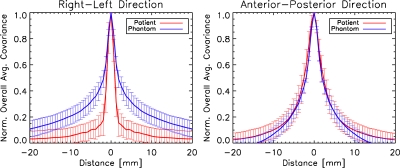
Results: Measured phantom relaxation values fall within 2 standard errors of human values from the literature and are reasonably stable over 9 months of testing. Comparison of the covariance matrices of phantom and patient data demonstrates that the phantom and patient data have similar image structure. Their covariance matrices are the same to within error bars in the anterior-posterior direction and to within about two error bars in the right-left direction. The signal from the phantom's adipose-mimicking material can be suppressed using active fat-suppression protocols. A static, enhancing lesion can also be included with the ability to change morphology and contrast agent concentration.

Conclusions: The authors have constructed a phantom and demonstrated its ability to mimic human breast images in terms of key physical properties that are relevant to breast MRI. This phantom provides a platform for the optimization and standardization of breast MRI imaging protocols for lesion detection and characterization.


Figures

Figure 1
Figure 1
Example patient and phantom images. All MRI images were acquired with a dedicated breast coil using either a 1.5 T Philips or a 1.5 T General Electric (GE) scanner: (a) Photograph of a phantom; (b) patient, T1-weighted, fat-suppressed, Philips scanner; (c) patient, T2 SPAIR (spectral adiabatic inversion recovery), fat-suppressed, Philips scanner; (d) phantom, T1-weighted, fat-suppressed, Philips scanner; (e) phantom, T1-weighted, fat-suppressed, GE scanner; and (f) phantom, T2-weighted, fat-suppressed, GE scanner. All scale bars are 10 mm. The bright signal near the top of images (e) and (f) is from glandular-mimicking phantom material in the fill ports of the phantom jar.
Figure 2
Figure 2
Comparison of phantom T1 and T2 values with human data from the literature. Error bars are one standard error. The lines plotted for the study of Graham et al. (Ref. 52) indicate contours that include the calculated 12.5% and 87.5% probability of their measured tissues. The T1 and T2 values of the phantom materials fall within 2 standard errors of the human data for both the adipose- and the fibroglandular-mimicking compartments. Data points for the phantom materials were measured on three different phantoms constructed using different lard temperatures and stirring velocities. The phantom T1 values are a better match to human data than the T2 values and are the primary determinants of image contrast for DCE-MRI studies.
Figure 3
Figure 3
Fractional change in T1 (left) and T2 (right) relaxation times of lard and egg whites as a function of time since phantom production date. All data points have been normalized by the relaxation value on the phantom production date. T1 and T2 relaxation values of both lard and egg are stable to within 8% and 15%, respectively, over a period of 9 months. Errors bars are the standard deviation over all voxels included in the computation for a single data set.
Figure 4
Figure 4
Example ROIs (cropped to 3.5 cm×3.5 cm) selected from the patient (top row) and phantom (bottom row) fat-suppressed, T1-weighted data. Note the resemblance in heterogeneity of the interlacing adipose and glandular tissues between phantom and patient images. Structures in the patient data appear to be more anisotropic than those in the phantom data and tend to elongate along the anterior-posterior direction. The phantom data also appear to have slightly better fat-suppression than the patient data.
Figure 5
Figure 5
Overall stationary covariance matrices for the patient and phantom data sets. The matrices are scaled to have the same intensity at their peak. The phantom and patient overall stationary covariance matrices have a similar covariance length in the anterior-posterior direction. However, the phantom has a larger covariance length than the patient in the right-left direction.
Figure 6
Figure 6
Cuts through the patient and phantom overall stationary covariance matrices (shown in Fig. 6) in the right-left and anterior-posterior directions. The patient and phantom overall stationary covariance matrices are the same to within their error bars along the anterior-posterior direction, but differ in the right-left direction. Error bars are the standard deviation of the individual patient- (n=64) and phantom-specific (n=20) stationary covariance matrices at each distance.
Figure 7
Figure 7
RMS variation in the stationary covariance estimate due to Rician instrumentation noise only as a function of the number of 35×35 voxel ROIs used in the estimation. Five different offset distances are shown. Compared to the size of the error bars in Fig. 6, which describe both anatomical and instrumentation errors, the instrumentation errors shown here are much less than the size of the error bars in the actual data in Fig. 6. This indicates that the error bars in Fig. 6 represent mostly anatomical variation.
Figure 8
Figure 8
(a) Photograph of round-shaped, mass-like simulating lesion (sphere internal diameter=10 mm). The three tubes toward the right connect the lesion with the phantom jar lid and allow for filling of the lesion with contrast agent as well as future dynamic contrast agent experiments. (b) Photograph of lobular-shaped, masslike simulating lesion (3 lobulations plus 10 mm internal diameter sphere diameter). (c) Fat-suppressed, T1-weighted, gradient-echo image (0.75 mm isotropic resolution, coronal slice) of a complete phantom with the round-shaped simulating lesion inserted and filled with gadolinium-doped water. (d) The same as (c) with the lobular-shaped simulating lesion.

References

    1. Leach M. O., “MRI for breast cancer screening,” Ann. Oncol. ZZZZZZ 17, x325–x331 (2006).10.1093/annonc/mdl281 - DOI - PubMed
    1. Kuhl C. K., “Current status of breast MR imaging. Part 2. Clinical applications,” Radiology RADLAX 244, 672–691 (2007).10.1148/radiol.2443051661 - DOI - PubMed
    1. Saslow D. et al., “American Cancer Society guidelines for breast screening with MRI as an adjunct to mammography,” Ca-Cancer J. Clin. CAMCAM 57, 75–89 (2007).10.3322/canjclin.57.2.75 - DOI - PubMed
    1. Katipamula R., Degnim A. C., Hoskin T., Boughey J. C., Loprinzi C., Grant C. S., Brandt K. R., Pruthi S., Chute C. G., Olson J. E., Couch F. J., Ingle J. N., and Goetz M. P., “Trends in mastectomy rates at the Mayo Clinic Rochester: Effect of surgical year and preoperative MRI,” J. Clin. Oncol. JCONDN 27, 4082–4088 (2009).10.1200/JCO.2008.19.4225 - DOI - PMC - PubMed
    1. Dinan M. A., Curtis L. H., Hammill B. G., E. F.Patz, Jr., Abernethy A. P., Shea A. M., and Schulman K. A., “Changes in the use and costs of diagnostic imaging among Medicare beneficiaries with cancer 1999–2006,” JAMA, J. Am. Med. Assoc. JAMAAP 303, 1625–1631 (2010).10.1001/jama.2010.460 - DOI - PubMed

Publication types