. 2011 Feb;38(2):1089-102.
doi: 10.1118/1.3539602.

Modeling the performance of a photon counting x-ray detector for CT: energy response and pulse pileup effects

Affiliations

Modeling the performance of a photon counting x-ray detector for CT: energy response and pulse pileup effects

Katsuyuki Taguchi et al. Med Phys. 2011 Feb.

Abstract

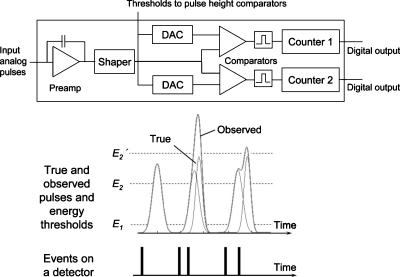
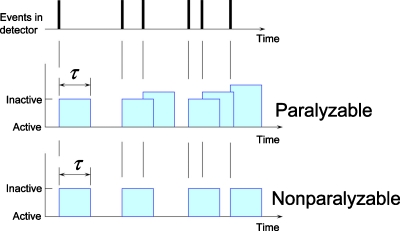
Purpose: Recently, photon counting x-ray detectors (PCXDs) with energy discrimination capabilities have been developed for potential use in clinical computed tomography (CT) scanners. These PCXDs have great potential to improve the quality of CT images due to the absence of electronic noise and weights applied to the counts and the additional spectral information. With high count rates encountered in clinical CT, however, coincident photons are recorded as one event with a higher or lower energy due to the finite speed of the PCXD. This phenomenon is called a "pulse pileup event" and results in both a loss of counts (called "deadtime losses") and distortion of the recorded energy spectrum. Even though the performance of PCXDs is being improved, it is essential to develop algorithmic methods based on accurate models of the properties of detectors to compensate for these effects. To date, only one PCXD (model DXMCT-1, DxRay, Inc., Northridge, CA) has been used for clinical CT studies. The aim of that study was to evaluate the agreement between data measured by DXMCT-1 and those predicted by analytical models for the energy response, the deadtime losses, and the distorted recorded spectrum caused by pulse pileup effects.

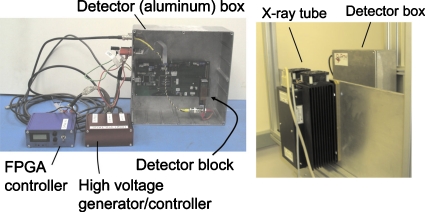
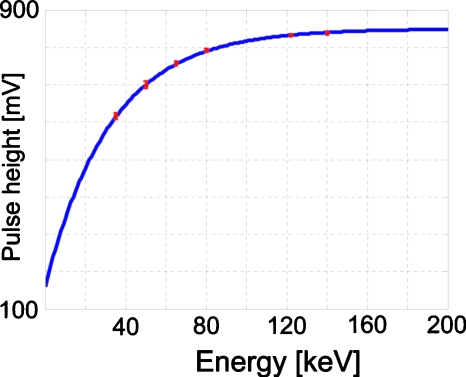
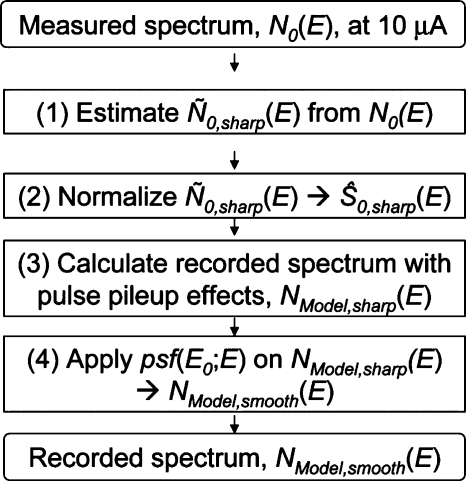
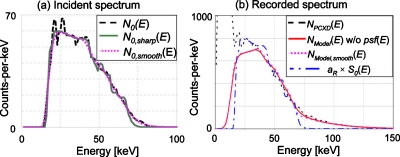
Methods: An energy calibration was performed using 99mTc (140 keV), 57Co (122 keV), and an x-ray beam obtained with four x-ray tube voltages (35, 50, 65, and 80 kVp). The DXMCT-1 was placed 150 mm from the x-ray focal spot; the count rates and the spectra were recorded at various tube current values from 10 to 500 microA for a tube voltage of 80 kVp. Using these measurements, for each pulse height comparator we estimated three parameters describing the photon energy-pulse height curve, the detector deadtime tau, a coefficient k that relates the x-ray tube current I to an incident count rate a by a = k x I, and the incident spectrum. The mean pulse shape of all comparators was acquired in a separate study and was used in the model to estimate the distorted recorded spectrum. The agreement between data measured by the DXMCT-1 and those predicted by the models was quantified by the coefficient of variation (COV), i.e., the root mean square difference divided by the mean of the measurement.

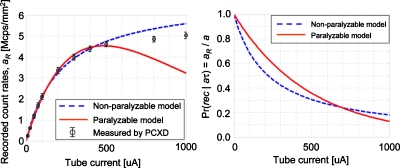
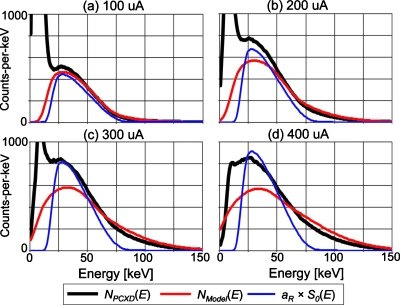
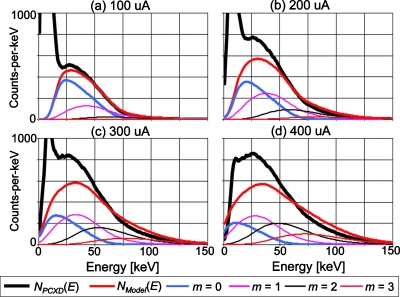
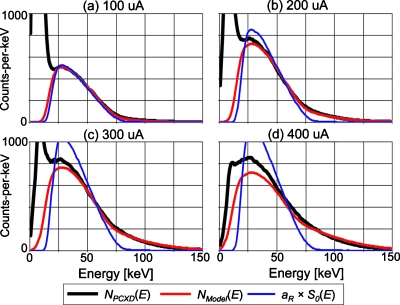
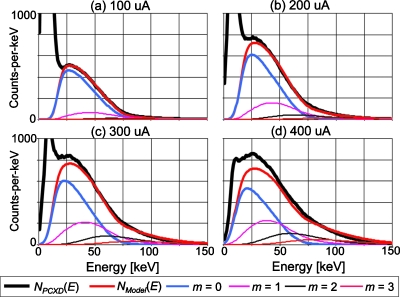
Results: Photon energy versus pulse height curves calculated with an analytical model and those measured using the DXMCT-1 were in agreement within 0.2% in terms of the COV. The COV between the output count rates measured and those predicted by analytical models was 2.5% for deadtime losses of up to 60%. The COVs between spectra measured and those predicted by the detector model were within 3.7%-7.2% with deadtime losses of 19%-46%.

Conclusions: It has been demonstrated that the performance of the DXMCT-1 agreed exceptionally well with the analytical models regarding the energy response, the count rate, and the recorded spectrum with pulse pileup effects. These models will be useful in developing methods to compensate for these effects in PCXD-based clinical CT systems.


Figures

Figure 1
Figure 1
(Top) The basic architecture of an individual channel in the ASIC. (Bottom) When the pulse height exceeds a given energy threshold value, a count will be added to an associated counter. Coincident photons will be recorded as one event with a higher energy level than the original energies.
Figure 2
Figure 2
The paralyzable detection model (middle) and the nonparalyzable detection model (bottom). Quasicoincident events will result in lost counts and a distorted recorded spectrum.
Figure 3
Figure 3
The DXMCT-1 (left) and the experimental setting (right).
Figure 4
Figure 4
The energy response curve, i.e., the photon energy-pulse height curve. The circles and the error bars are the means and the standard deviations of measurements obtained over all of the comparators. The curve is plotted by Eq. 1 with the means of the three parameters c1, c2, and c3 of all of the comparators.
Figure 5
Figure 5
(Left) The recorded count rates aR. The curves were plotted using the models with the mean of the estimated parameters of all the comparators. The circles and error bars show the mean counts and the standard deviation over multiple comparators measured at each of the tube current settings. (Right) Probability of events being counted, Pr(rec|aτ)=aRa=aR∕(kI), plotted using the means of the parameters τ and k estimated for each of the two detector models.
Figure 6
Figure 6
Area plots of the probability of pileup order m given the events-of-interest being recorded, Pr(m|rec).
Figure 7
Figure 7
The following three energy spectra for a tube setting of 80 kVp are shown: the mean energy spectrum measured by all of the comparators of DXMCT-1 (labeled NPCXD[E] in the figure); the energy spectrum predicted by the model of the spectral distortion caused by pulse pileup effects with the nonparalyzable detection model (labeled NModel[E]); and the scaled incident spectrum, aR×S0(E). The estimated incident count rate and deadtime loss ratio under the four tube current settings were 3.1 Mcps∕mm2 and 31% loss at 100 μA, 6.2 Mcps∕mm2 and 48% loss at 200 μA, 9.3 Mcps∕mm2 and 58% loss at 300 μA, and 12.4 Mcps∕mm2 and 64% loss at 400 μA.
Figure 8
Figure 8
The following energy spectra for a tube setting of 80 kVp are shown: the mean energy spectrum measured by all of the comparators of DXMCT-1 (labeled NPCXD[E] in the figure); the energy spectrum estimated by the model of the distorted, recorded spectrum with the nonparalyzable detection model (labeled NModel[E] in the figure); and those with pulse pileup orders m (labeled m=0, 1, 2, and 3, respectively, in the figure). The other conditions are the same as in Fig. 7.
Figure 9
Figure 9
The following three energy spectra for a tube setting of 80 kVp are shown: the mean energy spectrum measured by all of the comparators of DXMCT-1 (labeled NPCXD[E] in the figure); the energy spectrum predicted by the model of the spectral distortion caused by pulse pileup effects with the paralyzable detection model (labeled NModel[E]); and the scaled incident spectrum, aR×S0(E). The estimated incident count rate and deadtime loss ratio under the four tube current settings were 2.0 Mcps∕mm2 and 19% loss at 100 μA, 5.1 Mcps∕mm2 and 34% loss at 200 μA, 7.6 Mcps∕mm2 and 46% loss at 300 μA, and 10.1 Mcps∕mm2 and 56% loss at 400 μA.
Figure 10
Figure 10
The following energy spectra for a tube setting of 80 kVp are shown: the mean energy spectrum measured by all of the comparators of DXMCT-1 (labeled NPCXD[E] in the figure); the energy spectrum estimated by the model of the distorted, recorded spectrum with the paralyzable detection model (labeled NModel[E] in the figure); and those with pulse pileup order m (labeled m=0, 1, 2, and 3, respectively, in the figure). The other conditions are the same as in Fig. 9.
Figure 11
Figure 11
The flowchart of the method to incorporate the effect of the shift-variant energy resolution psf(E0;E) into the estimation of the recorded spectrum with pulse pileup effects NModel,smooth(E).
Figure 12
Figure 12
The effect of the shift-variant finite energy resolution. (a) The incident spectra of the typical comparator: N0(E), measured by DXMCT-1 (dashed curve); N0,sharp(E), processed by the procedure described in Appendix0 (solid curve); and N0,smooth(E), N0,sharp(E) filtered with the shift-variant energy resolution psf(E0;E) (dotted curve). (b) The recorded spectra of the typical comparator, at 200 μA with paralyzable detection model, estimated with the shift-variant finite energy resolution, NModel,smooth(E), and without, NModel(E). A linearly scaled incident spectrum aR×S0(E) is shown as a reference.

References

    1. Mettler F. J., Wiest P., Locken J., and Kelsey C., “CT scanning: patterns of use and dose,” J. Radiol. Prot. JRPREA 20, 353–359 (2000).10.1088/0952-4746/20/4/301 - DOI - PubMed
    1. Swank R. K., “Absorption and noise in x-ray phosphors,” J. Appl. Phys. JAPIAU 44, 4199–4203 (1973).10.1063/1.1662918 - DOI
    1. Alvarez R. E. and Macovski A., “Energy-selective reconstructions in x-ray computerised tomography,” Phys. Med. Biol. PHMBA7 21, 733–744 (1976).10.1088/0031-9155/21/5/002 - DOI - PubMed
    1. Yu L., Primak A. N., Liu X., and McCollough C. H., “Image quality optimization and evaluation of linearly mixed images in dual-source, dual-energy CT,” Med. Phys. MPHYA6 36, 1019–1024 (2009).10.1118/1.3077921 - DOI - PMC - PubMed
    1. Iwanczyk J. S., Nygard E., Meirav O., Arenson J., Barber W. C., Hartsough N. E., Malakhov N., and Wessel J. C., “Photon counting energy dispersive detector arrays for x-ray imaging,” IEEE Trans. Nucl. Sci. IETNAE 56, 535–542 (2009).10.1109/TNS.2009.2013709 - DOI - PMC - PubMed

Publication types