Comparative Study
. 2011 Nov;23(11):3355-65.
doi: 10.1162/jocn_a_00032. Epub 2011 Mar 31.

Comparison of primate prefrontal and premotor cortex neuronal activity during visual categorization

Affiliations
Comparative Study

Comparison of primate prefrontal and premotor cortex neuronal activity during visual categorization

Jason A Cromer et al. J Cogn Neurosci. 2011 Nov.

Abstract

Previous work has shown that neurons in the PFC show selectivity for learned categorical groupings. In contrast, brain regions lower in the visual hierarchy, such as inferior temporal cortex, do not seem to favor category information over information about physical appearance. However, the role of premotor cortex (PMC) in categorization has not been studied, despite evidence that PMC is strongly engaged by well-learned tasks and reflects learned rules. Here, we directly compare PFC neurons with PMC neurons during visual categorization. Unlike PFC neurons, relatively few PMC neurons distinguished between categories of visual images during a delayed match-to-category task. However, despite the lack of category information in the PMC, more than half of the neurons in both PFC and PMC reflected whether the category of a test image did or did not match the category of a sample image (i.e., had match information). Thus, PFC neurons represented all variables required to solve the cognitive problem, whereas PMC neurons instead represented only the final decision variable that drove the appropriate motor action required to obtain a reward. This dichotomy fits well with PFC's hypothesized role in learning arbitrary information and directing behavior as well as the PMC's role in motor planning.


Figures
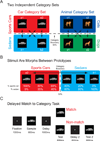
Figure 1
Figure 1. Stimulus Set & Behavioral Task
A: Visual stimuli were generated for two, independent category sets, Cars and Animals. The Car set was divided into "Sports Cars" vs. "Sedans" categories while the Animal set had "Cats" and "Dogs" categories. Each category set was formed based on two prototype images (shown) and morphs between those images along the four depicted morph lines (arrows) between all combinations of the prototypes within each set. B: Morphing allowed parameterization of sample images. An example morph line between Sports Car prototype a2 and Sedan prototype b1 displays images at the morph steps used for recording. Intermediate images were a mix of the two prototypes. Those images comprised of greater than 50% of one category (marked by the 'Category Boundary') were to be classified as a member of that category. Note how the 60%/40% morphs (nearest to the category boundary) are closer in physical similarity to each other than they are to the prototypes, yet they are categorized differently since they are on opposite sides of the category boundary. C: The delayed match to category task required monkeys to respond to whether a test stimulus matched the category of the sample stimulus. During the sample and delay periods, the monkeys must hold in memory the category of the sample stimulus but the outcome of the trial (i.e., the appropriate motor response) is unknown. During the test period, monkeys had to determine whether the test image was a category match to the sample image (and release the response bar) or a category non-match (and continue to hold the response bar).
Figure 2
Figure 2. Behavioral Results
Performance of both monkeys on the delayed match to category task with multiple, independent category distinctions across all recording sessions. Perfect performance would be 100% categorization of images >50% of one category and 0% categorization of images <50% of that one category (i.e., only classifying images >50% of a category as members of that category). Actual performance was similar and displayed a hallmark step function in behavior at the category boundary. The majority of errors came on the 60% (missed classifications) or 40% (incorrect classifications) morphs that were closest to the category boundary and therefore were expected to be the hardest to correctly categorize. Error bars represent standard error of the mean.
Figure 3
Figure 3. Single Neuron Examples - Category Sensitivity
A: A single PFC neuron that showed distinct firing for stimuli of one category (i.e., Sports Cars) vs. the other category (i.e., Sedans) starting during the robust burst of firing associated with stimulus onset and persisting throughout the delay and test epochs. Note how all morph percentages on either side of the category boundary (50%) grouped together (e.g., blue vs. red lines), despite the fact that sample images near the boundary line (60%/40%, darkest lines of each color group) were closer in physical similarity. Thus, this neuron responded to the category membership of the stimuli rather than their visual properties. B: A second PFC neuron that categorized Animals (Cats vs. Dogs) starting in the mid-delay period and into the test period.
Figure 4
Figure 4. ROCs - Category Sensitivity
ROC values showing where neurons differentiate between categories for each of the recorded 455 PFC neurons (left column) and 185 PMC neurons (right column). Bright orange colors indicate high category sensitivity. A: ROCs over time for all PFC neurons showing when there was a distinction between trials with Cat vs. Dog images (bright orange). Each row corresponds to a single neuron. Neurons were aligned if their ROC value reached 0.6 based on the earliest time of the ROC reaching this threshold. The earliest neurons show information shortly after the sample stimulus onset and approximately 1/3 of recorded neurons reach the 0.6 threshold. B: ROCs for all PMC neurons with high values indicating a distinction between Cat vs. Dog trials. Note the lack of orange coloring indicating few PMC neurons that were category sensitive. C: ROCs for all PFC neurons during Car trials indicate a large percentage of PFC neurons differentiated between Sports Cars vs. Sedans. Latencies are similar to Animal categorization but more neurons show activation during the sample period. D: ROCs for all PMC neurons during Car trials again indicate little category information in the PMC.
Figure 5
Figure 5. Mean ROCs for each Category Scheme
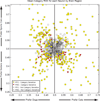
Mean ROC values for all recorded neurons in the PFC (circles) and PMC (triangles) to both category distinctions. Colored points indicate significant category sensitivity as determined via t-test for one or both categories. Values closer to the origin indicate weaker category sensitive for the given distinction (x values indicate the Animal category distinction, y values indicate the Car distinction). Data points furthest from the origin indicate those neurons with the strongest category selectivity (yellow circles). PMC neurons that were category sensitive (red triangles) had weaker category information than the strongest PFC neurons.
Figure 6
Figure 6. Single Neuron Examples - Match Sensitivity
A: A single PMC neuron distinguished between when test images match ('match', solid lines) or did not match ('non-match', dashed lines) the sample images across trials. This distinction occurred regardless of whether images were from the animal or car category sets (lines cluster as solid vs. dashed rather than red vs. blue). This neuron's firing rate was higher during match trials so it is said to have "match enhancement". B: A single PMC neuron that distinguished match from non-match trials but had a lower firing rate for match trials and is thus characterized as having "match suppression".
Figure 7
Figure 7. ROCs - Match Sensitivity
A: ROC values for each of the recorded 455 PFC neurons across the test epoch with bright orange colors indicating sensitivity for match vs. non-match trials, aligned when neurons reached a 0.6 ROC threshold. Similar to category effects, over 1/3 of PFC neurons displayed match information. B: ROC values for each of the 185 recorded PMC neurons show that a majority of PMC neurons dissociate match from non-match trials.
Figure 8
Figure 8. Latencies - Match Sensitivity
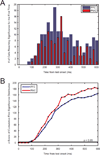
A: Histograms of the number of cells reaching significance for the first time in each 25ms time bin after test onset for the PFC (blue) and PMC (red). Note that there were 455 recorded PFC neurons and 185 PMC neurons, so raw counts are not directly comparable. B: Z-scores of the cumulative first significance distribution (see methods) allowed comparison of latencies across the PFC and PMC. Both regions reach significance (p < 0.05 or 2 standard deviations above the mean) at the 100ms time bin.

References

    1. Beymer D, Poggio T. Image representations for visual learning. Science. 1996;272(5270):1905–1909. - PubMed
    1. Boettiger CA, D'Esposito M. Frontal networks for learning and executing arbitrary stimulus-response associations. J Neurosci. 2005;25(10):2723–2732. - PMC - PubMed
    1. Bolte S, Holtmann M, Poustka F, Scheurich A, Schmidt L. Gestalt perception and local-global processing in high-functioning autism. J Autism Dev Disord. 2007;37(8):1493–1504. - PubMed
    1. Buschman TJ, Miller EK. Top-down versus bottom-up control of attention in the prefrontal and posterior parietal cortices. Science. 2007;315(5820):1860–1862. - PubMed
    1. Cromer JA, Roy JE, Miller EK. Representation of multiple, independent categories in the primate prefrontal cortex. Neuron. 2010;66(5):796–807. - PMC - PubMed

Publication types