. 2011 Spring;12(1):71-7.
doi: 10.1089/ham.2010.1038.

Cerebral oxygenation in awake rats during acclimation and deacclimation to hypoxia: an in vivo electron paramagnetic resonance study

Affiliations

Cerebral oxygenation in awake rats during acclimation and deacclimation to hypoxia: an in vivo electron paramagnetic resonance study

Jeff F Dunn et al. High Alt Med Biol. 2011 Spring.

Abstract

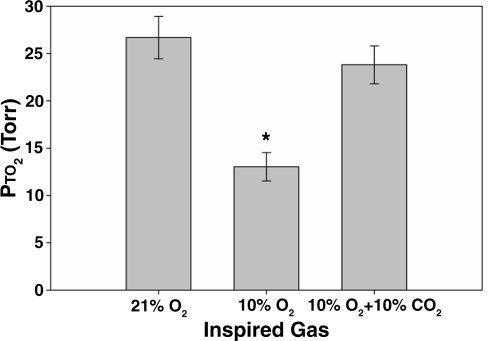
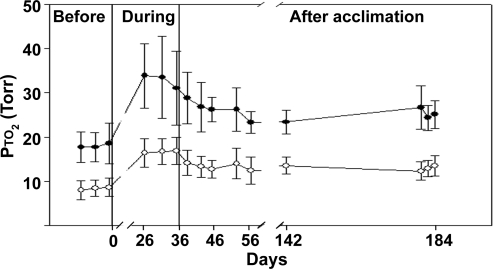
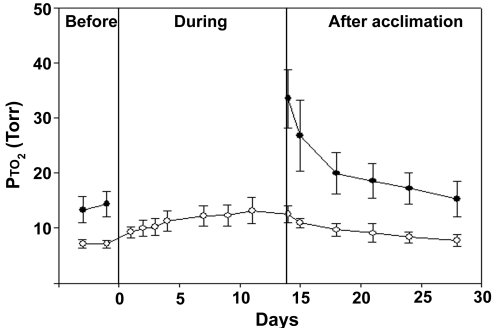
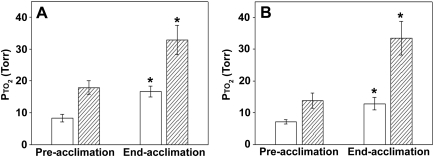
Exposure to high altitude or hypobaric hypoxia results in a series of metabolic, physiologic, and genetic changes that serve to acclimate the brain to hypoxia. Tissue Po(2) (Pto(2)) is a sensitive index of the balance between oxygen delivery and utilization and can be considered to represent the summation of such factors as cerebral blood flow, capillary density, hematocrit, arterial Po(2), and metabolic rate. As such, it can be used as a marker of the extent of acclimation. We developed a method using electron paramagnetic resonance (EPR) to measure Pto(2) in unanesthetized subjects with a chronically implanted sensor. EPR was used to measure rat cortical tissue Pto(2) in awake rats during acute hypoxia and over a time course of acclimation and deacclimation to hypobaric hypoxia. This was done to simulate the effects on brain Pto(2) of traveling to altitude for a limited period. Acute reduction of inspired O(2) to 10% caused a decline from 26.7 ± 2.2 to 13.0 ± 1.5 mmHg (mean ± SD). Addition of 10% CO(2) to animals breathing 10% O(2) returned Pto(2) to values measured while breathing 21% O(2,) indicating that hypercapnia can reverse the effects of acute hypoxia. Pto(2) in animals acclimated to 10% O(2) was similar to that measured preacclimation when breathing 21% O(2). Using a novel, individualized statistical model, it was shown that the T(1/2) of the Pto(2) response during exposure to chronic hypoxia was approximately 2 days. This indicates a capacity for rapid adaptation to hypoxia. When subjects were returned to normoxia, there was a transient hyperoxygenation, followed by a return to lower values with a T(1/2) of deacclimation of 1.5 to 3 days. These data indicate that exposure to hypoxia results in significant improvements in steady-state oxygenation for a given inspired O(2) and that both acclimation and deacclimation can occur within days.


Figures

FIG. 1.
FIG. 1.
MRI of brain with LiPc implant. MRIs were done at 7T with a spin echo sequence (TR/TE = 1000/30 s), multislice, FOV = 3 m, matrix 256 × 256. These are example MRIs from two different animals. The arrows show the needle tracks.The MRIs were used prestudy to confirm that the implant is in the cortical gray matter. MRIs were obtained between 7 and 10 days postimplant.
FIG. 2.
FIG. 2.
EPR calibration. (A) Example EPR line shapes measured while gases of the indicated O2% were presented to the LiPc crystal. The line width of the EPR spectrum becomes narrower as the oxygen levels decrease. Arrows indicate the points used to calculate line width with a curve-fitting program. The scale of the lower curve (0% O2) has been multiplied ×25 for better visualization. (B) Example calibration curve of a crystal of LiPc. Each point is the measured line width obtained in the presence of a different O2 concentration. The Po2 is shown on the y- axis so that, in the resulting calibration equation, the Po2 can be obtained from a measured line width during the study without transforming the linear equation.
FIG. 3.
FIG. 3.
Brain Pto2 during acute exposure to hypoxia and hypoxia + hypercapnia in awake restrained animals (mean ± SD, n = 4). * Pto2 declined significantly while breathing 10% O2. There was no significant difference between the Pto2 measured while breathing 21% O2 and that measured while breathing 10% O2 with 10% CO2 (ANOVA, with a Tukey-B post hoc test, p < 0.05).
FIG. 4.
FIG. 4.
Time course of brain Pto2 values during inhalation of 21% and 10% O2 before, during, and after acclimation to 1/2 atm barometric pressure (study 1). All measurements were obtained under normobaric conditions while breathing either 21% O2 (closed circles) or 10% O2 (open circles). The pressure in the chamber was ambient during the before and after time points. Data obtained during acclimation were in an acute normobaric condition. The animals were living in a chamber depressurized to approximately 1/2 atm and were acutely depressurized and maintained at either 21% or 10% O2 (see Methods). Note that the x-axis is nonlinear, with the acclimation data being collected at days 27, 32, and 36 of acclimation (mean ± SD, n = 6; ANOVA, with a Tukey-B post hoc test, p < 0.05).
FIG. 5.
FIG. 5.
Time course of brain Pto2 values during inhalation of 21% and 10% O2 before, during, and after acclimation to 1/2 atm barometric pressure (study 2). All measurements were obtained under normobaric conditions while breathing either 21% O2 (closed circles) or 10% O2 (open circles). The pressure in the chamber was ambient during the before and after time points. The chamber was depressurized to approximately 1/2 atm (see Methods) during acclimation. This study (vs. Fig. 4) quantified the changes while breathing 10% O2 during the time course of acclimation and over a shorter recovery period (mean ± SD, n = 7).
FIG. 6.
FIG. 6.
Average brain Pto2 values during inhalation of 21% and 10% O2 before and after acclimation to 11/2 atm in study 1 (A) and study 2 (B). Open bars, 10%; hatched bars, 21%. (A) Data are combined from measurements on three separate dates before acclimation to obtain preacclimation values and three dates ranging over 27 to 36 days of acclimation to obtain end-acclimation values (mean ± SD, n = 6). (B) Data are combined from measurements on two dates before acclimation. Data from the last day of acclimation are used for the end acclimation. *Denotes significant difference from respective preacclimation values. There is no significant difference between the Pto2 measured while breathing 21% before acclimation and that measured while breathing 10% after acclimation in either study 1 or study 2 (ANOVA, with a Tukey B post hoc test, p < 0.05).

References

    1. Ainslie P.N. Ashmead J.C. Ide K. Morgan B.J. Poulin M.J. Differential responses to CO2 and sympathetic stimulation in the cerebral and femoral circulations in humans. J. Physiol. 2005;566:613–624. - PMC - PubMed
    1. Apkon M. Boron W.F. (1995). Extracellular and intracellular alkalinization and the constriction of rat cerebral arterioles.[erratum appears in J. Physiol. (Lond) 1995 Aug 1; 486(Pt 3):795] J. Physiol. 484:743–753. - PMC - PubMed
    1. Baumann R. Bauer C. Bartels H. Influence of chronic and acute hypoxia on oxygen affinity and red cell 2,3 diphosphoglycerate of rats and guinea pigs. Resp. Physiol. 1971;11:135–144. - PubMed
    1. Bereczki D. Wei L. Otsuka T. Hans F.J. Acuff V. Patlak C. Fenstermacher J. Hypercapnia slightly raises blood volume and sizably elevates flow velocity in brain microvessels. Am. J. Physiol. 1993;264:H1360–H1369. - PubMed
    1. Boero J.A. Ascher J. Arregui A. Rovainen C. Woolsey T.A. Increased brain capillaries in chronic hypoxia. J. Appl. Physiol. 1999;86:1211–1219. - PubMed

Publication types