. 2011 Mar 31:5:48.
doi: 10.1186/1752-0509-5-48.

Impact of receptor clustering on ligand binding

Affiliations

Impact of receptor clustering on ligand binding

Bertrand R Caré et al. BMC Syst Biol. .

Abstract

Background: Cellular response to changes in the concentration of different chemical species in the extracellular medium is induced by ligand binding to dedicated transmembrane receptors. Receptor density, distribution, and clustering may be key spatial features that influence effective and proper physical and biochemical cellular responses to many regulatory signals. Classical equations describing this kind of binding kinetics assume the distributions of interacting species to be homogeneous, neglecting by doing so the impact of clustering. As there is experimental evidence that receptors tend to group in clusters inside membrane domains, we investigated the effects of receptor clustering on cellular receptor ligand binding.

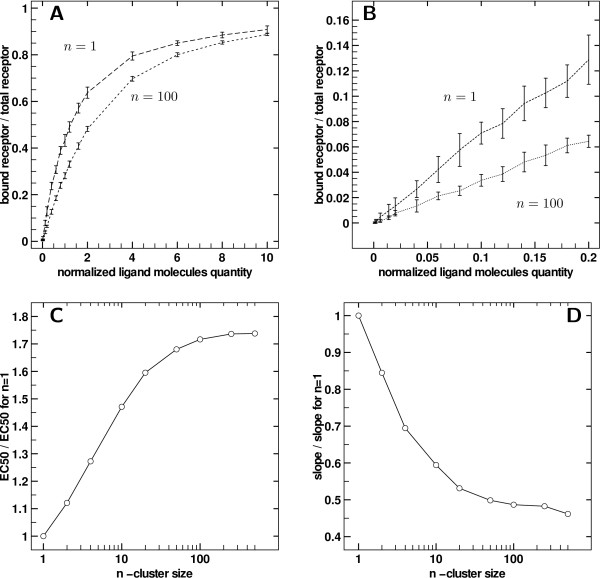
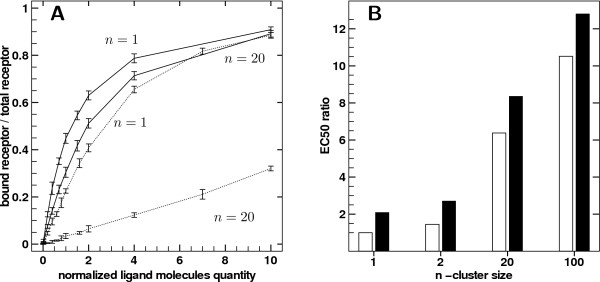
Results: We implemented a model of receptor binding using a Monte-Carlo algorithm to simulate ligand diffusion and binding. In some simple cases, analytic solutions for binding equilibrium of ligand on clusters of receptors are provided, and supported by simulation results. Our simulations show that the so-called "apparent" affinity of the ligand for the receptor decreases with clustering although the microscopic affinity remains constant.

Conclusions: Changing membrane receptors clustering could be a simple mechanism that allows cells to change and adapt its affinity/sensitivity toward a given stimulus.


Figures

Figure 1
Figure 1
Model validation and clusters of over stacked receptors. A) Dose response for reference size n = 1 (no cluster) and various cluster sizes n ∈ {2, 5, 10, 20}. The curves have the same saturation value (lim c = 1 when l → ∞). The slope at the origin is 1/n and the EC50 n/2. B) Efficient concentration according to the degree of clustering. The line is EC50 = n/2 and the circles are the solution of formula image 
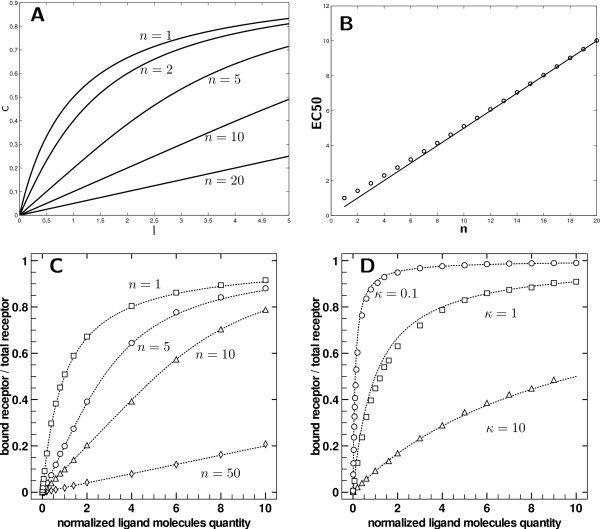
using Eq. 4. C) Results for normalized receptor binding with κ = 1 and for n ∈ {1, 5, 10, 50} sites by receptor (respectively squares, circles, triangles, diamonds) compared to theoretical dose response according to Eq. 4 (dashed lines) with same n. D) Results of normalized receptor binding for three experiments (circles: κ = 0.1, squares: κ = 1, triangles: κ = 10) compared to theoretical dose responses for respective κ according to Eq. 2 (dashed lines).
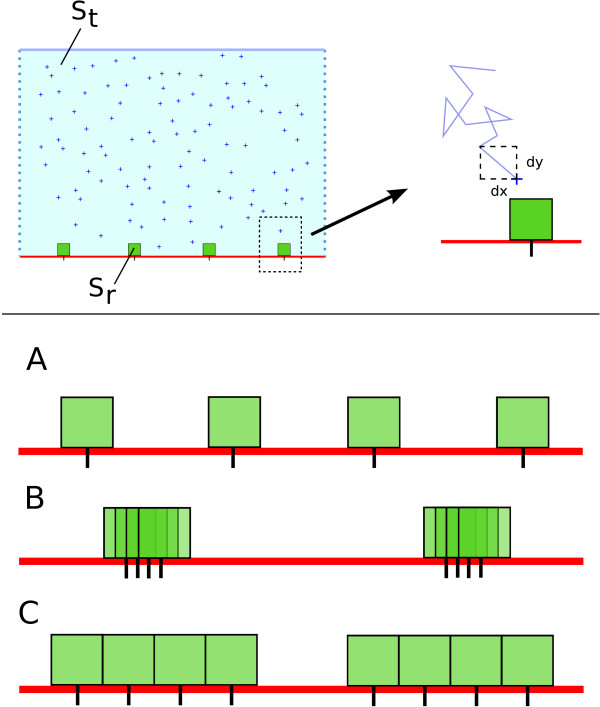
Figure 2
Figure 2
Simulation environment. Top panel: On the left is a cartoon view of the 2D membrane of area St. Ligand particles are crosses, and the green boxes are receptors (of affinity zone Sr). Receptors are fixed, and ligands undergo a 2D Brownian motion. Bottom panel: cartoon view of the different experiments performed. The spatial configuration of the receptors is modified and the computation of the occupation is performed. Three spatial configuration are tested: A) Evenly spaced receptors - homogeneous repartition. B) Over stacked receptors: the clusters are evenly spaced, but contain a certain number of sites C) Non-overlapping spatial configuration. The affinity zones are contiguous but do not overlap. Clusters of n receptors are evenly placed on the membrane.
Figure 3
Figure 3
Effect of clustering for contiguous receptors. A) Dose response for n = 1 (control) and n = 100 receptors per cluster. Error bars are ± standard deviation. B) Close-up of A for l ≤ 0.2. Error bars are ± standard deviation. C) Ratio of fitted EC50 to control EC50 (i.e. for n = 1) with increasing cluster size, with contiguous receptors, in semi-logarithmic scale. D) Ratio of fitted slope at origin to slope at origin for n = 1, with increasing cluster size, with contiguous receptors, in semi-logarithmic scale.
Figure 4
Figure 4
Effect of rebinding on receptor occupation at equilibrium. A) Comparison of dose response curves between n = 1 and n = 20 when ligand is dropped at the edge of affinity surface when unbound (solid lines - standard simulations) or ligand randomly reinjected in bulk when unbound (dashed lines). B) Black bars: ratio obtained with the same layout but using E50 obtained with random reinjection normalized by E50 obtained with normal reinjection. White bars: ratio obtained for random reinjection using EC50 computed for various cluster sizes normalized by E50 with no clusters (n = 1).
Figure 5
Figure 5
Receptor occupation when affinity surfaces partially overlapped within a cluster. A) Comparison of occupation as a function of relative overlap of affinity surfaces. On a single curve, points correspond to the same experiment, for a fixed ligand concentration, but with varying overlap. Error bars are ± standard deviation. B) Cartoon representing increasingly overlapped receptor affinity surfaces within clusters.
Figure 6
Figure 6
Receptor spacing, affinity zone size and clustering. A) Cartoon representing clusters of receptors with different receptor size width (r) on affinity zone width (b) ratio. A fixed affinity zone as it was used in simulation with a increasing receptor width leads to an increasing r/b ratio and therefore to sparser clusters of receptors. B) Ratio of fitted EC50 to control EC50 (i.e. for n = 1) with increasing cluster size, with contiguous receptors and with respect to receptor width on affinity zone width ratio. The scale is semi-logarithmic.
Figure 7
Figure 7
Clustering effect with different ligand diffusion coefficients. Ratio of fitted EC50 to control EC50 (i.e. for n = 1) with increasing cluster size, with contiguous receptors and with respect to the ligand coefficient diffusion used in simulation. The scale is semi-logarithmic.

Similar articles

Cited by

References

    1. Heffetz D, Yehiel Z. Receptor Aggregation Is Necessary for Activation of the Soluble Insulin Receptor Kinase. J Biol Chem. 1986;261:889–894. - PubMed
    1. Flörke RR, Schnaith K, Passlack W, Wichert M, Kuehn L, Fabry M, Federwisch M, Reinauer H. Hormone-triggered conformation changes within the insulin-receptor ectodomain: requirement for transmembrane anchors. Biochem J. 2001;360:189–198. - PMC - PubMed
    1. Changeux JP, Edelstein SJ. Allosteric Receptors after 30 Years. Neuron. 1998;21:959–980. doi: 10.1016/S0896-6273(00)80616-9. - DOI - PubMed
    1. Greenfield D, McEvoy AL, Shroff H, Crooks GE, Wingreen NS, Betzig E, Liphardt J. Self-Organization of the Escherichia coli Chemotaxis Network Imaged with Super-Resolution Light Microscopy. PLoS Biology. 2009;7:6. doi: 10.1371/journal.pbio.1000137. - DOI - PMC - PubMed
    1. Murray JD. Mathematical Biology: I. An Introduction. Springer; 2002.

Publication types