. 2011 Mar 31:4:28.
doi: 10.1186/1755-8794-4-28.

Immunological network signatures of cancer progression and survival

Affiliations

Immunological network signatures of cancer progression and survival

Trevor Clancy et al. BMC Med Genomics. .

Abstract

Background: The immune contribution to cancer progression is complex and difficult to characterize. For example in tumors, immune gene expression is detected from the combination of normal, tumor and immune cells in the tumor microenvironment. Profiling the immune component of tumors may facilitate the characterization of the poorly understood roles immunity plays in cancer progression. However, the current approaches to analyze the immune component of a tumor rely on incomplete identification of immune factors.

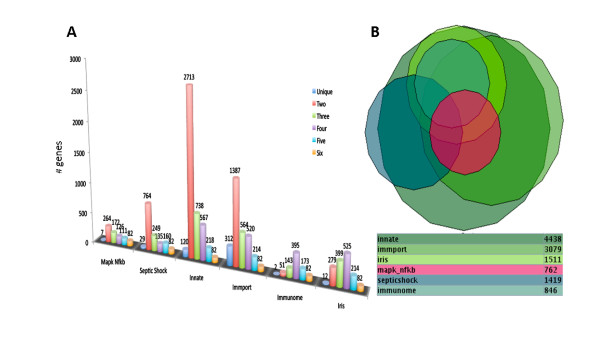
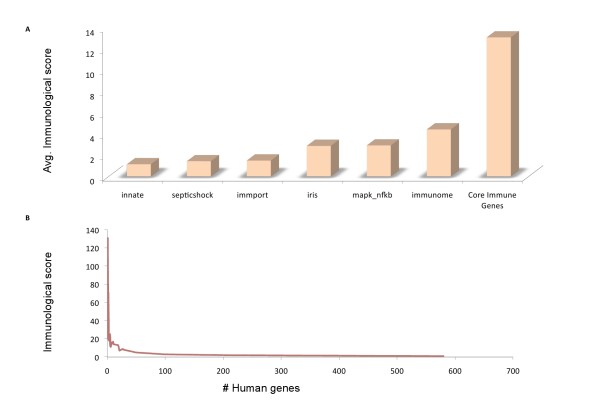
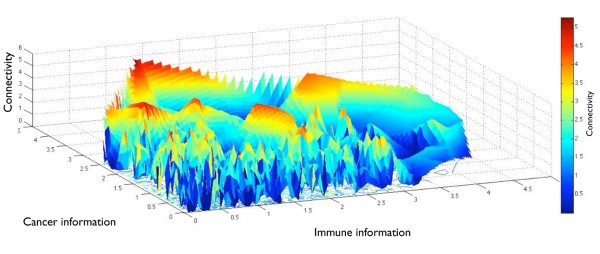
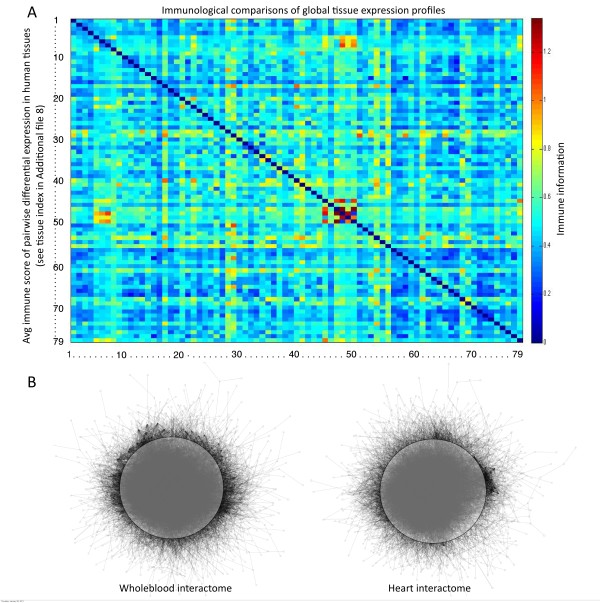
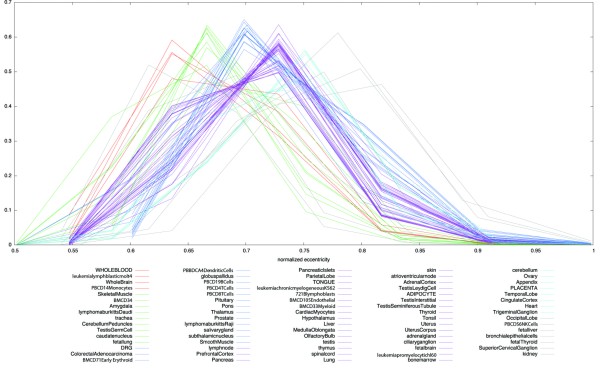
Methods: To facilitate a more comprehensive approach, we created a ranked immunological relevance score for all human genes, developed using a novel strategy that combines text mining and information theory. We used this score to assign an immunological grade to gene expression profiles, and thereby quantify the immunological component of tumors. This immunological relevance score was benchmarked against existing manually curated immune resources as well as high-throughput studies. To further characterize immunological relevance for genes, the relevance score was charted against both the human interactome and cancer information, forming an expanded interactome landscape of tumor immunity. We applied this approach to expression profiles in melanomas, thus identifying and grading their immunological components, followed by identification of their associated protein interactions.

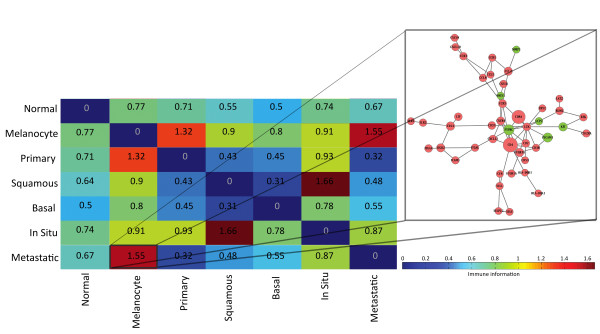
Results: The power of this strategy was demonstrated by the observation of early activation of the adaptive immune response and the diversity of the immune component during melanoma progression. Furthermore, the genome-wide immunological relevance score classified melanoma patient groups, whose immunological grade correlated with clinical features, such as immune phenotypes and survival.

Conclusions: The assignment of a ranked immunological relevance score to all human genes extends the content of existing immune gene resources and enriches our understanding of immune involvement in complex biological networks. The application of this approach to tumor immunity represents an automated systems strategy that quantifies the immunological component in complex disease. In so doing, it stratifies patients according to their immune profiles, which may lead to effective computational prognostic and clinical guides.


Figures

Figure 1
Figure 1
Heterogeneous distribution of genes in immune databases and an incomplete catalogue of immune knowledge. (A) Bar chart depicting the shared gene distribution of the immune resources. 82 of the total integrated set of 4833 genes are common to all 6 manually curate resources (orange colored bar). Few genes were unique to an individual database, ranging from a minimum of two for "Immunome" and 122 for the "Innate". (B) An approximation using a Venn Euler diagram illustrates the heterogeneous overlap among the different databases. The Innate database being the largest resource has the largest intersections. The septic shock resource has smaller overlaps with the others (with the exception of Innate) highlighting its focus on collating genes related to the response to bacterial toxins during septic shock.
Figure 2
Figure 2
Benchmarking of immunological relevance scores against manually curated immune resources. (A) The mean immune score for each database is depicted in the bar chart. The core immune genes are those 82 genes that are common to all immune resources and have a significantly larger amount of information content in comparison to each of the individual immune resources. (B) The frequency distribution of all HUGO name assigned genes reveals a sharp decline in immune relevance across the genome.
Figure 3
Figure 3
The tumor-immunity interactome landscape. A three-dimensional surface plot representing the landscape of degree centrality (connectivity) of the interactome in the context of immune and cancer relevance: All axes are on the log scale and values above one on the log scale were considered high in terms of immune and cancer relevance. The consideration of one on the log scale as high in terms of immune relevance is made on the basis of the average immune scores for the expert sources ranging from 1 bit and above (see Figure 2). The color scale in the heatmap is representative of the connectivity of each gene in the human interactome. That which is apparent is the distinct areas of scattered high and low connectivity for genes in the cancer-immune landscape. The underlying data for this plot is detailed in Additional File 5.
Figure 4
Figure 4
Immunological components of normal tissue. (A) Heatmap of the immunological gene expression fold-change comparisons among the 79 tissues from the SymAtlas [24]. This matrix displays the average immune score from those genes that contribute to greater than 2 times fold change difference between each tissue's pairwise comparisons. This combination of expression profiling and immunological grading detects a heterogeneous difference in the immunological components between tissues in a global manner. Both the X and Y-axis are numerical index of the 79 tissues (the mapping of this index to tissue name is listed in Additional File 8). With respect to the robustness of immune genes in the interactome : (B) Tissue specific interactome networks for Wholeblood (eccentricity centrality = 0.67) and Heart (eccentricity centrality = 0.72). The difference in the average eccentricity value is only marginally visible by eye as evidenced by a lower symmetry of the Heart network (the same transparent circle drawn on top of the two networks displayed by means of the same algorithm using the software yEd).
Figure 5
Figure 5
Normalized frequency distribution of tissue specific eccentricity. The distribution (i.e., normalized frequency) of the gene eccentricity centralities for each of the tissue specific interactome networks (the same 79 human tissues profiled in Figure 4). Different network groups can be classified on the basis of the maximal value of the eccentricity distribution. Some network groups have a differential maximal value of distribution, and immune cells had the lowest values. The lower eccentricity values of immune cells reinforce the postulate that immune genes have robust reach throughout the human interactome. Equal colors in the legend correspond to equal maximal values of the normalized eccentricity.
Figure 6
Figure 6
Comparison of the immunological component of skin cancer and states of melanoma progression. A heatmap of the average bits of immune information of the differentially expressed genes (> 2 times fold-change) among the pairwise comparisons of normal skin and skin cancer states. The labels from the left to right columns refer to normal skin tissues: ("Normal"), normal melanocyte ("Melanocyte") and then various states of skin cancer: primary melanoma ("Primary"), squamous cell carcinoma ("Squamous"), basal cell carcinoma ("Basal"), in-situ melanoma ("In Situ") and metastatic melanoma ("Metastatic"). Distinct differences in the immunological component of the various skin cancer and normal states are detected. We have focused here as an example, on the comparison between metastatic melanoma and normal human melanocytes. A subnetwork module from the interactome landscape of those genes with high immunological relevance is displayed. Upregulated genes are color-coded red and downregulated genes are color-coded green in this network. The size of a gene is proportional to the immunological relevance of the gene. There is clearly increased T-cell activity such as the presence of increased expression of CD8, CD4 and CD3 T-cell markers. This coincides with upregulation of key chemokine and cytokine interactions.

Similar articles

Cited by

References

    1. Virchow RL. Die Krankhaften Geschwülste Dreissig Vorlesungen gehalten während des Wintersemesters 1862-63 Vierte Vorlesung. Vol. 1. Berlin; 1863. p. 65.
    1. Mantovani A, Allavena P, Sica A, Balkwill F. Cancer-related inflammation. Nature. 2008;454:436–444. doi: 10.1038/nature07205. - DOI - PubMed
    1. Galon J. Type, Density, and Location of Immune Cells Within Human Colorectal Tumors Predict Clinical Outcome. Science. 2006;313:1960–1964. doi: 10.1126/science.1129139. - DOI - PubMed
    1. Dave SS, Wright G, Tan B, Rosenwald A, Gascoyne RD, Chan WC, Fisher RI, Braziel RM, Rimsza LM, Grogan TM. et al.Prediction of survival in follicular lymphoma based on molecular features of tumor-infiltrating immune cells. N Engl J Med. 2004;351:2159–2169. doi: 10.1056/NEJMoa041869. - DOI - PubMed
    1. Bogunovic D, O'Neill DW, Belitskaya-Levy I, Vacic V, Yu YL, Adams S, Darvishian F, Berman R, Shapiro R, Pavlick AC. et al.Immune profile and mitotic index of metastatic melanoma lesions enhance clinical staging in predicting patient survival. Proc Natl Acad Sci USA. 2009;106:20429–20434. doi: 10.1073/pnas.0905139106. - DOI - PMC - PubMed

Publication types

MeSH terms