. 2011 Mar 31:10:74.
doi: 10.1186/1475-2875-10-74.

Simple flow cytometric detection of haemozoin containing leukocytes and erythrocytes for research on diagnosis, immunology and drug sensitivity testing

Affiliations

Simple flow cytometric detection of haemozoin containing leukocytes and erythrocytes for research on diagnosis, immunology and drug sensitivity testing

Rosangela Frita et al. Malar J. .

Abstract

Background: Malaria pigment (haemozoin, Hz) has been the focus of diverse research efforts. However, identification of Hz-containing leukocytes or parasitized erythrocytes is usually based on microscopy, with inherent limitations. Flow cytometric detection of depolarized Side-Scatter is more accurate and its adaptation to common bench top flow cytometers might allow several applications. These can range from the ex-vivo and in-vitro detection and functional analysis of Hz-containing leukocytes to the detection of parasitized Red-Blood-Cells (pRBCs) to assess antimalarial activity.

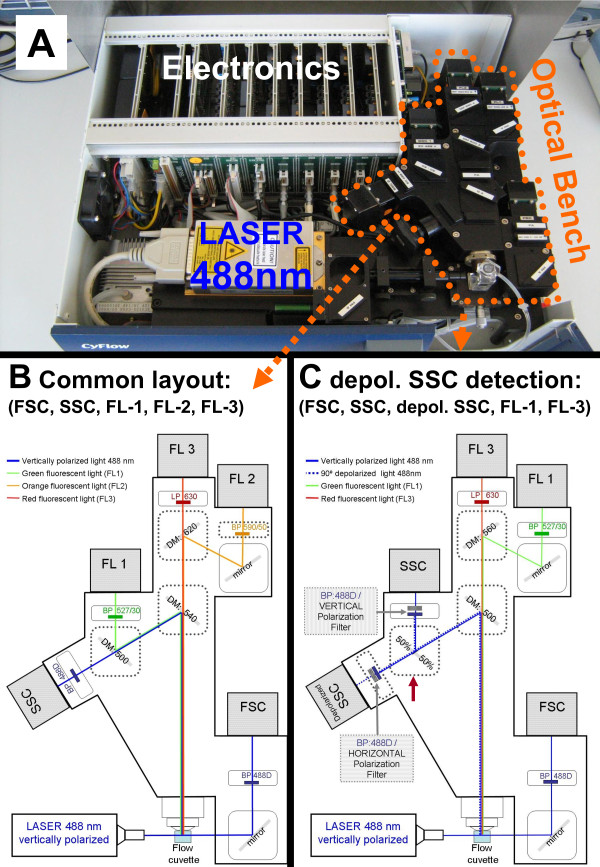
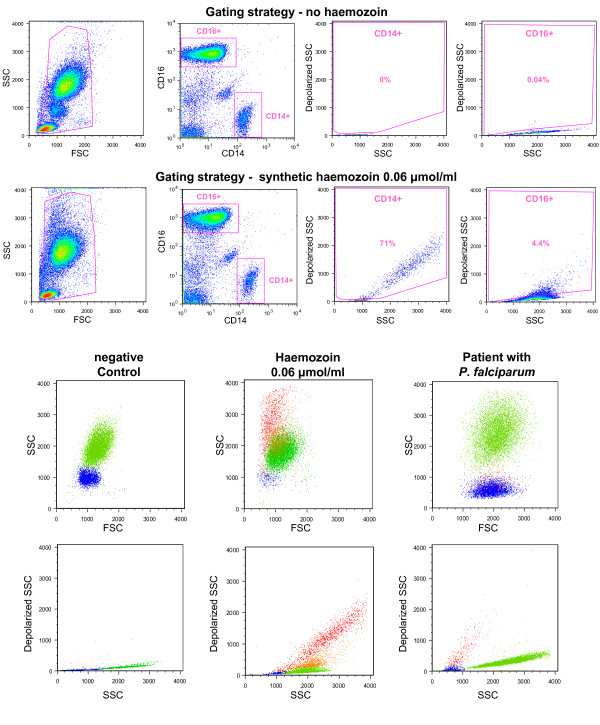
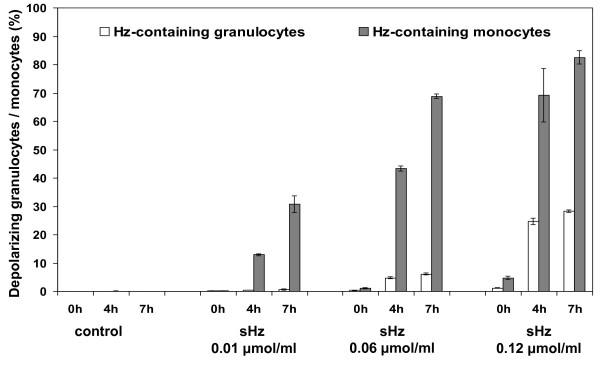
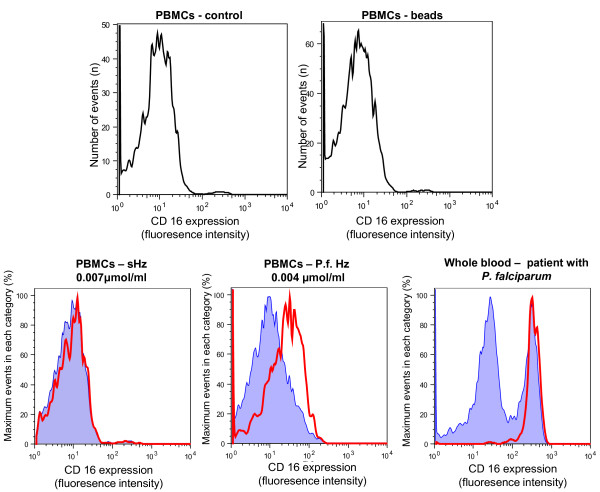
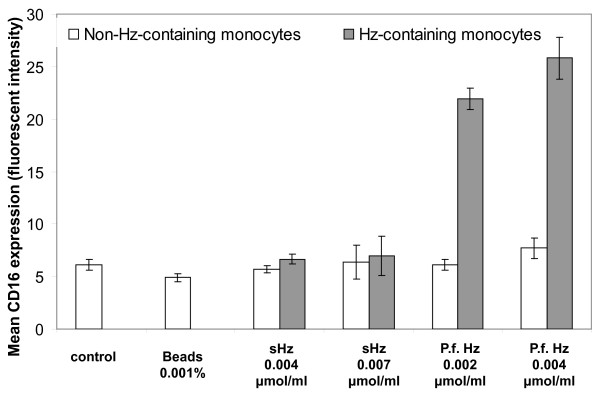
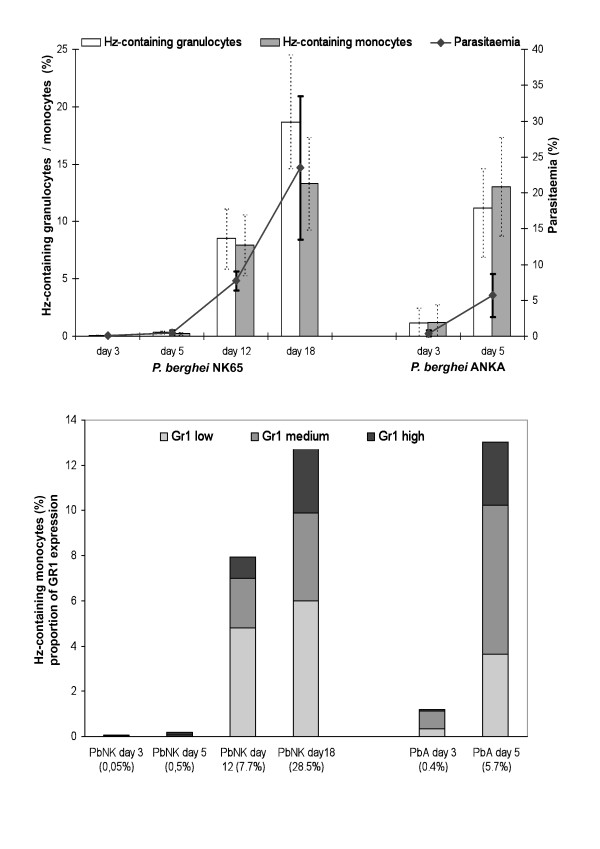
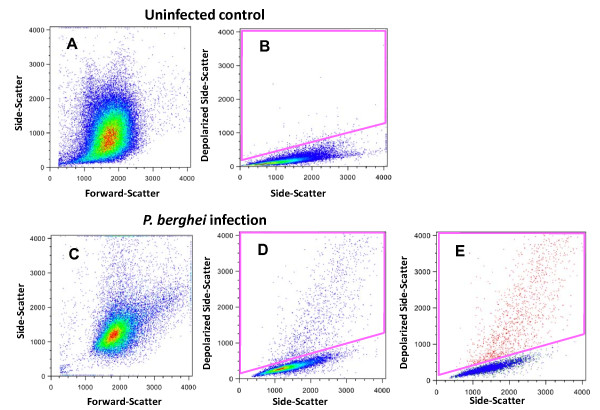
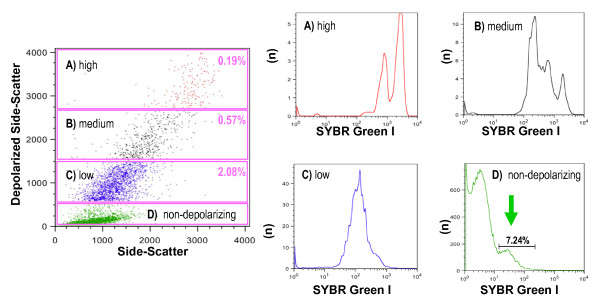
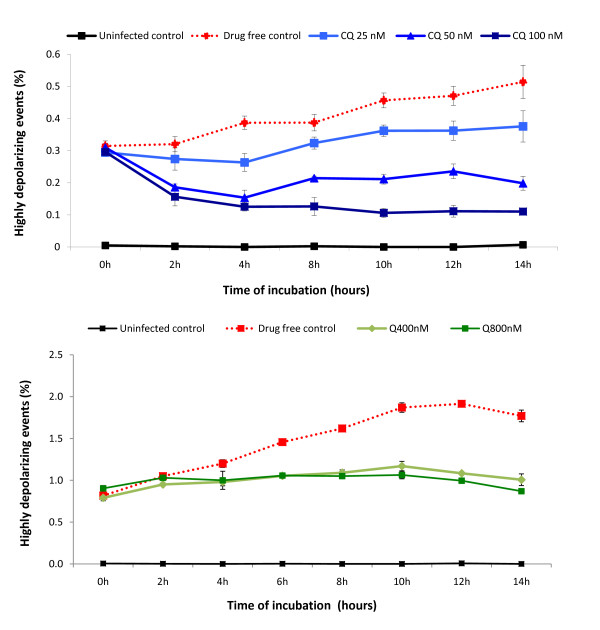
Methods: A standard benchtop flow cytometer was adapted to detect depolarized Side-Scatter. Synthetic and Plasmodium falciparum Hz were incubated with whole blood and PBMCs to detect Hz-containing leukocytes and CD16 expression on monocytes. C5BL/6 mice were infected with Plasmodium berghei ANKA or P. berghei NK65 and Hz-containing leukocytes were analysed using CD11b and Gr1 expression. Parasitized RBC from infected mice were identified using anti-Ter119 and SYBR green I and were analysed for depolarized Side Scatter. A highly depolarizing RBC population was monitored in an in-vitro culture incubated with chloroquine or quinine.

Results: A flow cytometer can be easily adapted to detect depolarized Side-Scatter and thus, intracellular Hz. The detection and counting of Hz containing leukocytes in fresh human or mouse blood, as well as in leukocytes from in-vitro experiments was rapid and easy. Analysis of CD14/CD16 and CD11b/Gr1 monocyte expression in human or mouse blood, in a mixed populations of Hz-containing and non-containing monocytes, appears to show distinct patterns in both types of cells. Hz-containing pRBC and different maturation stages could be detected in blood from infected mice. The analysis of a highly depolarizing population that contained mature pRBC allowed to assess the effect of chloroquine and quinine after only 2 and 4 hours, respectively.

Conclusions: A simple modification of a flow cytometer allows for rapid and reliable detection and quantification of Hz-containing leukocytes and the analysis of differential surface marker expression in the same sample of Hz-containing versus non-Hz-containing leukocytes. Importantly, it distinguishes different maturation stages of parasitized RBC and may be the basis of a rapid no-added-reagent drug sensitivity assay.


Figures

Figure 1
Figure 1
Alterations to the optical bench of a common bench-top flow cytometer which allows detection of depolarized side-scatter. a) The lid of the CyFLow® Blue flow cytometer can be easily removed and filters can be swapped by the operator. b) Light path in conventional filter set-up for detection of Forward Scatter (FSC), Side-Scatter (SSC), green (FL-1), orange (FL-2) and red (FL-3) fluorescence. c) Filter set-up that allows detection of depolarized Side-Scatter instead of FL-2 detection. Squares with broken line indicate dichroic mirrors that need to be changed. Red error shows 50%/50% beam splitter. Other beam splitters which divert more light to the depolarized SSC are possible, such as 90%/10% or even 95%/5%. DM = Dichroic Mirror; BP = Bandpass filter, LP = Longpass filter, numbers indicate wavelength in nm.
Figure 2
Figure 2
Detection of Hz-containing monocytes and granulocytes in human whole blood. Top rows: Gating strategy for detection of haemozoin (Hz) containing monocytes (CD14+) and granulocytes (CD16+). Top row: blood from healthy donor without Hz, second row: incubated for 7 hours with synthetic haemozoin (0.06 μmol/ml heme-equivalent). Using plots from healthy volunteers (top row) gates were created to identify depolarizing monocytes and granulocytes. Bottom two rows: Colour backgating for samples shown in row one and two, as well as for a patient with P. falciparum malaria (0.2% parasitaemia). Blue = non-depolarizing monocytes, red = depolarizing monocytes, green = non-depolarizing granulocytes, orange = depolarizing granulocytes.
Figure 3
Figure 3
Phagocytosis of haemozoin in-vitro depends on dose and incubation time. Whole Blood from a healthy human volunteer was incubated with synthetic haemozoin (sHz) at 0.01, 0.06 and 0.12 μmol/ml of heme equivalent and with no sHz (control). The percentage of Hz-containing granulocytes (open bars) and monocytes (grey bars) was determined at time zero, and after four and seven hours of incubation. Identification of leukocytes and depolarization as described in the text and shown in figure 2. Results are the mean values of triplicates (± one SD)
Figure 4
Figure 4
Different expression of CD16 on Hz-containing monocytes. PBMCs were isolated from blood of a healthy human volunteer and were incubated with synthetic Hz (0.007 μmol/ml heme-equivalent) and with Plasmodium falciparum Hz (P.f.Hz) at 0.004 μmol/ml heme-equivalent. PBMCs incubated with latex beads and with no Hz were used as controls. CD14+ monocytes were gated, analysed for depolarization and then analysed for CD16 expression. Patient with P. falciparum malaria (0.2% parasitaemia) 2 days into treatment (bottom right panel). Blue shaded area: non-depolarizing monocytes, red line depolarizing monocytes.
Figure 5
Figure 5
CD16 expression on monocytes fed with different types of haemozoin in-vitro. PBMCs were isolated from blood of a healthy human volunteer and were incubated with synthetic Hz (sHz) at 0.004 and 0.007 μmoles/ml heme equivalent and with Plasmodium falciparum Hz (P.f.Hz) at 0.002 and 0.004 μmol/ml heme equivalent. PBMCs incubated with latex beads and with no Hz were used as controls. Cells were incubated for 6 hours and then labelled with anti-CD14 and anti-CD16. The Geometric mean values for expression of CD16 were calculated for non-Hz containing monocytes (open bars) and Hz-containing monocytes (grey bars). Differences between sHZ and P.f. were significant (P < 0.01). Shown are values of triplicates (± one SD). Controls and beads had no depolarizing populations.
Figure 6
Figure 6
Haemozoin containing leukocytes in two different mouse models of malaria. Groups with five C57BL/6 mice where infected with P. berghei ANKA (PbA) or with P. berghei NK65 (PbNK). Blood was drawn on day 3, 5 12 and 18 and analysed after labelling with with anti-CD11b and Gr1. Analyses and gating strategy is described in the text (additional file 1). Percentage of Hz-containing monocytes and granulocytes (top graph) as well as parasitaemia are mean values per group (± one SD). Open bars = Hz-containing granulocytes; grey bars = Hz-containing monocytes. Uninfected controls had no Hz-containing leukocytes and are not shown. Bottom graph shows proportion of different Gr1 expression (high = black, medium = grey; and low = light grey) of Hz-containing monocytes, shown in top figure. Percentages on x-axis represent mean parasitemia. Mice with PbANKA infection were sacrificed on day 5.
Figure 7
Figure 7
Detection of haemozoin in P. berghei ANKA infected mouse RBC. Uninfected control (upper panel). Whole blood from a C57BL/6 mouse with a parasitaemia of 8.1% (lower panel). Gate to indentify the depolarizing events in the control (0.2% events) (B) and in the infected mouse RBC (4.7% events) (D). Depolarizing events in this gate (D) were indentified as erythrocytes by anti-TER119 staining (> 97% positive) and are shown as red dots in E. Colours in plots A-D represent frequency of events. In plot E colour backgating; with blue = TER119 positive events without depolarization, red = TER119 positive events which depolarize; and green = any other event
Figure 8
Figure 8
Degree of depolarization corresponds to different developmental stages of P. berghei ANKA. Blood from a C57BL/6 mouse with a parasitaemia of 9.7% as determined by microscopy. Top plot shows several populations with decreasing degree of depolarization (A, B, C). Gate D shows low or non-depolarizing events. The four histograms show the number of events (n) and their fluorescence intensity (x-axis) of SYBR Green I, representing the DNA content. Gate D contains a population of 7.24% (arrow), likely including ring-forms with little Hz and thus very low or no depolarization.
Figure 9
Figure 9
Inhibitory effect of chloroquine and quinine on Hz containing parasites within unlysed RBC. Blood from PbA infected C57BL/6 mice with parasitaemias around 5% were incubated with different concentrations of chloroquine (upper graph) or quinine (lower graph). The percentage of highly depolarizing events is shown (gate A in Figure 8). Each point represents the mean of triplicate measurements (± one SD). CQ = chloroquine, Q = quinine.

Similar articles

Cited by

References

    1. Hänscheid T, Egan TJ, Grobusch MP. Hemozoin: from melatonin pigment to drug target, diagnostic tool, and immune modulator. Lancet Infect Dis. 2007;7:675–685. - PubMed
    1. Shio MT, Kassa FA, Bellemare MJ, Olivier M. Innate inflammatory response to the malarial pigment hemozoin. Microbes Infect. 2010;12:889–899. doi: 10.1016/j.micinf.2010.07.001. - DOI - PubMed
    1. Kremsner PG, Valim C, Missinou MA, Olola C, Krishna S, Issifou S, Kombila M, Bwanaisa L, Mithwani S, Newton CR, Agbenyega T, Pinder M, Bojang K, Wypij D, Taylor T. Prognostic value of circulating pigmented cells in african children with malaria. J Infect Dis. 2009;199:142–150. doi: 10.1086/595295. - DOI - PMC - PubMed
    1. Lawrence C, Olson JA. Birefringent hemozoin identifies malaria. Am J Clin Pathol. 1986;86:360–363. - PubMed
    1. Hanscheid T, Frita R, Langin M, Kremsner P, Grobusch M. Is flow cytometry better in counting malaria pigment-containing leukocytes compared to microscopy? Malar J. 2009;8:255. doi: 10.1186/1475-2875-8-255. - DOI - PMC - PubMed

Publication types

MeSH terms