Comparative Study
. 2011 Jun;95(1-2):35-50.
doi: 10.1016/j.eplepsyres.2011.02.011. Epub 2011 Mar 30.

Quantitative multi-compartmental SPECT image analysis for lateralization of temporal lobe epilepsy

Affiliations
Comparative Study

Quantitative multi-compartmental SPECT image analysis for lateralization of temporal lobe epilepsy

Kourosh Jafari-Khouzani et al. Epilepsy Res. 2011 Jun.

Abstract

This study assesses the utility of compartmental analysis of SPECT data in lateralizing ictal onset in cases of a putative mesial temporal lobe epilepsy (mTLE). An institutional archival review provided 46 patients (18M, 28F) operated for a putative mTLE who achieved an Engel class Ia postoperative outcome. This established the standard to assure a true ictal origin. Ictal and interictal SPECT images were separately coregistered to T1-weighted (T1W) magnetic resonance (MR) image using a rigid transformation and the intensities matched with an l(1) norm minimization technique. The T1W MR image was segmented into separate structures using an atlas-based automatic segmentation technique with the hippocampi manually segmented to improve accuracy. Mean ictal-interictal intensity difference values were calculated for select subcortical structures and the accuracy of lateralization evaluated using a linear classifier. Hippocampal SPECT analysis yielded the highest lateralization accuracy (91%) followed by the amygdala (87%), putamen (67%) and thalamus (61%). Comparative FLAIR and volumetric analyses yielded 89% and 78% accuracies, respectively. A multi-modality analysis did not generate a higher accuracy (89%). A quantitative anatomically compartmented approach to SPECT analysis yields a particularly high lateralization accuracy in the case of mTLE comparable to that of quantitative FLAIR MR imaging. Hippocampal segmentation in this regard correlates well with ictal origin and shows good reliability in the preoperative analysis.


Conflict of interest statement

CONFLICT OF INTEREST

The authors declare that they have no conflict of interest.

Figures
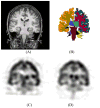
Fig. 1
Fig. 1
Coregistration of MR and SPECT images. (A) T1W MR coronal image. (B) Color-coded anatomical segmentation using the FreeSurfer software (Fischl et al., 2002). Interictal (C) and ictal (D) SPECT images coregistered to the indicated T1W MR image.
Fig. 2
Fig. 2
Outcome of matching two one-dimensional signals with similar shapes. (A) The signal shapes differ in a small region resembling a site of hyperperfusion on ictal SPECT study and hypoperfusion on interictal study. The results of signal matching are shown using three techniques: mean ratio (B), l2 norm (C) and l1 norm (D).
Fig. 3
Fig. 3
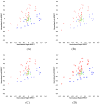
Scatter plots of left and right hippocampal mean values of SPECT ictal (A) and interictal (B) signal intensity. Cases are distinguished by the symbols, ‘R’ and ‘L’, respectively, corresponding to individual cases in which the right or left hippocampus was judged to be epileptogenic according to Engel class Ia postoperative outcomes. The symbols ‘o’ and ‘x’ represent ECD and HMPAO control subjects, respectively. The ictal scatter plot (A) has been scaled to clearly show the difference between left-sided and right-sided subjects. This scaling resulted in elimination of six subjects (4L, 2R) from the graph. These subjects were correctly classified using the illustrated boundary line.
Fig. 4
Fig. 4
Scatter plots of left and right hippocampal mean values of SPECT ictal-interictal difference. (A) Cases are distinguished by the symbols, ‘R’ and ‘L’, respectively, corresponding to individual cases in which the right or left hippocampus was judged to be epileptogenic according to Engel class Ia postoperative outcomes. The symbols ‘o’ and ‘x’ represent ECD and HMPAO control subjects, respectively. (B) Cases are distinguished according to whether they required solely scalp electroencephalographic application to distinguish laterality (‘1’) or further extraoperative ECoG (‘2’). (C) Cases are distinguished by the symbols, ‘Y’ and ‘N’, respectively, according to whether medial temporal sclerosis (MTS) was appreciated by qualitative assessment of MR images with those identified as MTS labeled ‘Y’ and the others, ‘N’. (D) Cases are identified by their numerical assignment for cross-referencing of clinical profiles (see Table 1).
Fig. 5
Fig. 5
Representative ictal (first row) and interictal (second row) SPECT images of cases misclassified by quantitative (31, 38), qualitative (5, 39, 41) and by both (10, 12) approaches, respectively. Cases are identified by number in each column.
Fig. 6
Fig. 6
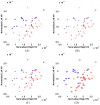
Scatter plots of the mean and standard deviation ratios (right/left) of hippocampal FLAIR MR signal intensity. (A) The symbols, ‘R’ and ‘L’, respectively, correspond to the right and left surgery sides. (B) Cases are distinguished according to their requirement for extraoperative ECoG (i.e., ‘1’ indicating those cases proceeding to surgery without such study and ‘2’, those cases requiring it). (C) Cases are distinguished by the symbols, ‘Y’ and ‘N’, respectively, according to whether medial temporal sclerosis (MTS) was appreciated by qualitative assessment of MR images with those identified as MTS labeled ‘Y’ and the others, ‘N’. (D) Cases are identified by their numerical assignment for cross-referencing of clinical profiles (see Table 1).
Fig. 7
Fig. 7
Scatter plots of normalized hippocampal volumes (HVs). (A) The symbols, ‘R’ and ‘L’, respectively, correspond to the right and left surgery sides. (B) Patients proceeding to resection without the need for extraoperative ECoG (‘1’) and those who required intracranial study prior to resection (‘2’) are identified. (C) Cases are distinguished by the symbols, ‘Y’ and ‘N’, respectively, according to whether medial temporal sclerosis (MTS) was appreciated by qualitative assessment of MR images with those identified as MTS labeled ‘Y’ and the others, ‘N’. (D) Cases are identified by their numerical assignment for cross-referencing of clinical profiles (see Table 1).

Similar articles

Cited by

References

    1. Akhondi-Asl A, Jafari-Khouzani K, Elisevich K, Soltanian-Zadeh H. Hippocampal volumetry for lateralization of temporal lobe epilepsy: Automated versus manual methods. Neuroimage. In Press. - PMC - PubMed
    1. Annegers JF, Hauser WA, Coan SP, Rocca WA. A population-based study of seizures after traumatic brain injuries. N Engl J Med. 1998;338:20–24. - PubMed
    1. Aubert-Broche B, Grova C, Jannin P, Buvat I, Benali H, Gibaud B. Detection of inter-hemispheric asymmetries of brain perfusion in SPECT. Physics in Medicine and Biology. 2003;48:1505–1517. - PubMed
    1. Aubert-Broche B, Jannin P, Biraben A, Bernard AM, Haegelen C, Le Jeune FP, Gibaud B. Evaluation of methods to detect interhemispheric asymmetry on cerebral perfusion SPECT: application to epilepsy. Journal of Nuclear Medicine. 2005;46:707–713. - PubMed
    1. Avery RA, Zubal IG, Stokking R, Studholme C, Corsi M, Seibyl JP, Spencer SS. Decreased cerebral blood flow during seizures with ictal SPECT injections. Epilepsy Res. 2000;40:53–61. - PubMed

Publication types

MeSH terms