

Creating national air pollution models for population exposure assessment in Canada
- PMID: 21454147
- PMCID: PMC3237350
- DOI: 10.1289/ehp.1002976
Creating national air pollution models for population exposure assessment in Canada
Abstract
Background: Population exposure assessment methods that capture local-scale pollutant variability are needed for large-scale epidemiological studies and surveillance, policy, and regulatory purposes. Currently, such exposure methods are limited.
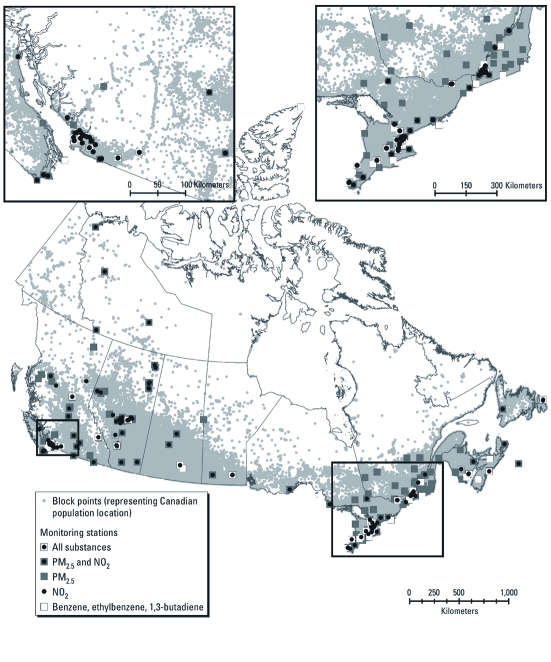
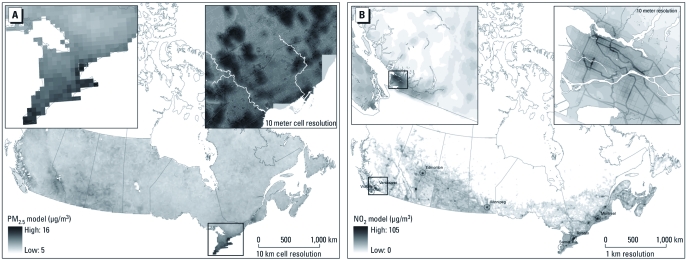
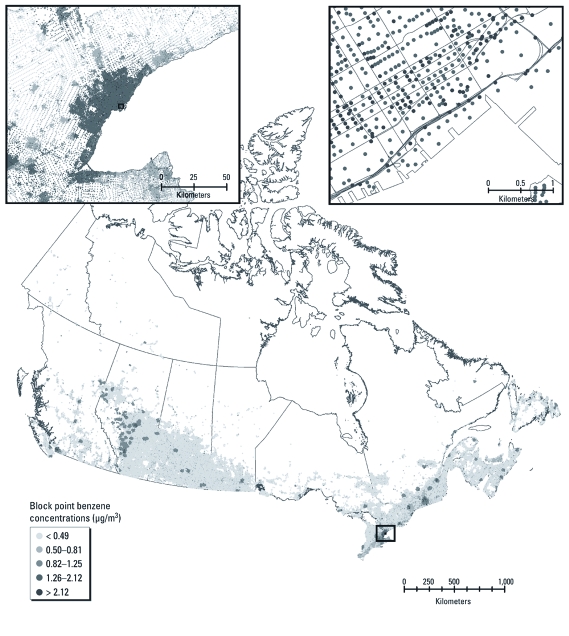
Methods: We created 2006 national pollutant models for fine particulate matter [PM with aerodynamic diameter ≤ 2.5 μm (PM2.5)], nitrogen dioxide (NO2), benzene, ethylbenzene, and 1,3-butadiene from routinely collected fixed-site monitoring data in Canada. In multiple regression models, we incorporated satellite estimates and geographic predictor variables to capture background and regional pollutant variation and used deterministic gradients to capture local-scale variation. The national NO2 and benzene models are evaluated with independent measurements from previous land use regression models that were conducted in seven Canadian cities. National models are applied to census block-face points, each of which represents the location of approximately 89 individuals, to produce estimates of population exposure.
Results: The national NO2 model explained 73% of the variability in fixed-site monitor concentrations, PM2.5 46%, benzene 62%, ethylbenzene 67%, and 1,3-butadiene 68%. The NO2 model predicted, on average, 43% of the within-city variability in the independent NO2 data compared with 18% when using inverse distance weighting of fixed-site monitoring data. Benzene models performed poorly in predicting within-city benzene variability. Based on our national models, we estimated Canadian ambient annual average population-weighted exposures (in micrograms per cubic meter) of 8.39 for PM2.5, 23.37 for NO2, 1.04 for benzene, 0.63 for ethylbenzene, and 0.09 for 1,3-butadiene.
Conclusions: The national pollutant models created here improve exposure assessment compared with traditional monitor-based approaches by capturing both regional and local-scale pollution variation. Applying national models to routinely collected population location data can extend land use modeling techniques to population exposure assessment and to informing surveillance, policy, and regulation.
Conflict of interest statement
The authors declare they have no actual or potential competing financial interests.
Figures
Comment in
-
A pollution model upgrade? Incorporating the local scale in national models.Environ Health Perspect. 2011 Aug;119(8):A355. doi: 10.1289/ehp.119-a355a. Environ Health Perspect. 2011. PMID: 21807596 Free PMC article. No abstract available.
References
-
- Allen RW, Amram O, Wheeler A, Brauer M. The transferability of NO and NO2 land use regression models between cities and pollutants. Atmos Environ. 2010;45(2):369–378.
-
- Beckerman B, Jerrett M, Brook JR, Verma DK, Arain MA, Finkelstein MM. Correlation of nitrogen dioxide with other traffic pollutants near a major expressway. Atmos Environ. 2008;42(2):275–290.
-
- Beelen R, Hoek G, Pebesma E, Vienneau D, de Hoogh K, Briggs DJ. Mapping of background air pollution at a fine spatial scale across the European Union. Sci Total Environ. 2009;407(6):1852–1867. - PubMed
-
- Carex Canada. Surveillance of Environmental and Occupational Exposures for Cancer Prevention. Carcinogen Database. 2011. Available: http://www.carexcanada.ca/en/our_research [accessed 15 January 2011]
Publication types
MeSH terms
Substances
LinkOut - more resources
Full Text Sources
Medical
