. 2011 May 6;286(18):16229-37.
doi: 10.1074/jbc.M110.204701. Epub 2011 Mar 23.

Polyethylene glycol (PEG)-induced mouse model of choroidal neovascularization

Affiliations

Polyethylene glycol (PEG)-induced mouse model of choroidal neovascularization

Valeriy V Lyzogubov et al. J Biol Chem. .

Abstract

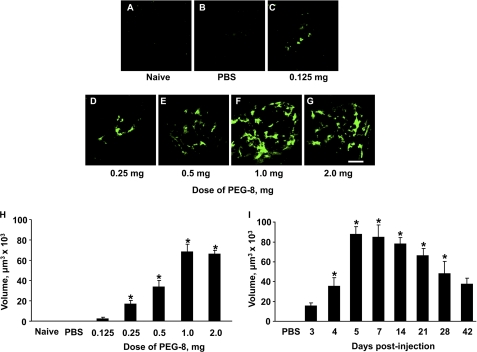
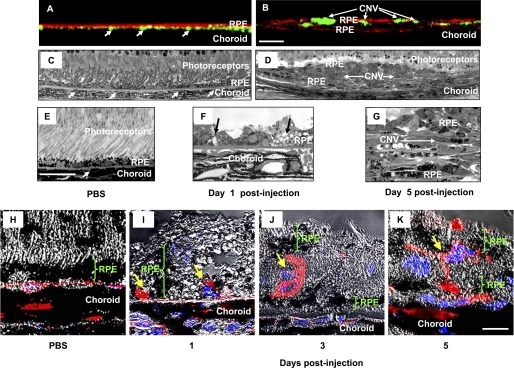
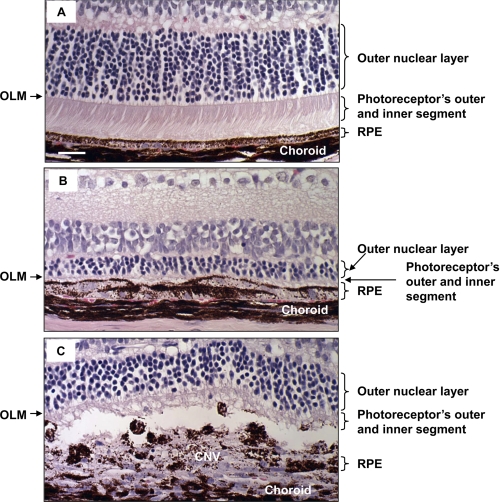
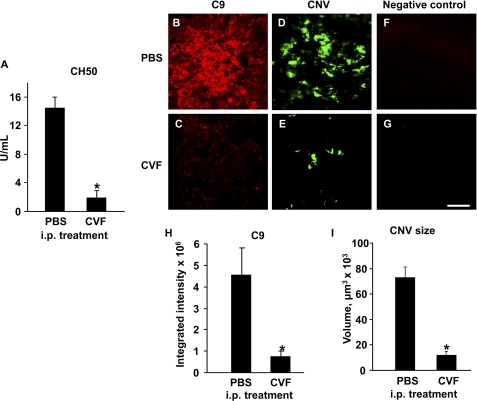
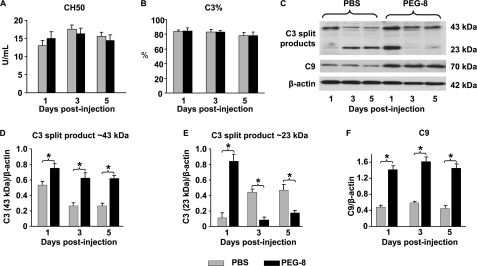
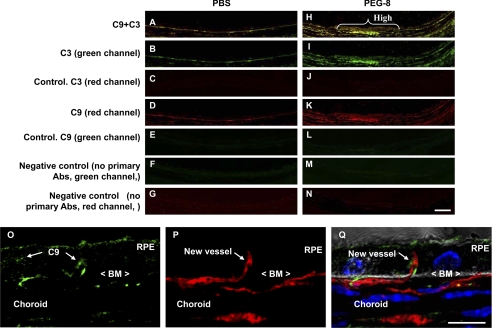
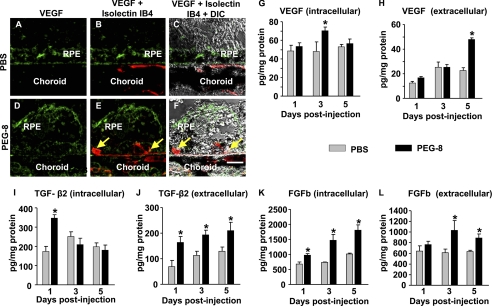
In this study, we describe a new method for inducing choroidal neovascularization (CNV) in C57BL/6 mice, an animal model of wet age-related macular degeneration (AMD). AMD is a disease that causes central blindness in humans. We injected PEG-8 subretinally in different doses (0.125-2 mg) to induce CNV. After PEG-8 injection, we examined CNV at several time points (days 3-42). We also used Western blotting, immunohistochemistry, and ELISA to examine the complement component C3 split products, C9, VEGF, TGF-β2, and basic FGF. As early as day 1 after treatment, we found that a single subretinal injection of 1 mg of PEG-8 increased the C3 split products and the C9, TGF-β2, and basic FGF levels in the retinal pigment epithelium-choroid tissue. By day 3 after PEG-8 injection, the intraocular activation of the complement system caused induction and progression of CNV, including new vessels penetrating the Bruch's membrane. At day 5 after PEG-8 injection, we observed a fully developed CNV and retinal degeneration. Thus, in this study, we present a new, inexpensive, and accelerated mouse model of CNV that may be useful to study AMD.


Figures

FIGURE 1.
FIGURE 1.
Effect of different doses of PEG-8 on CNV size and time course of PEG-induced CNV. A and B, no CNV was found in the naive and PBS-injected animals, respectively. C–G, shown is CNV (green) after subretinal injections of different doses of PEG-8. F and H, a PEG-8 dose of 1.0 mg induced CNV of maximal size. I, after a subretinal injection of 1 mg of PEG-8, CNV was detected for the first time at day 3 post-injection, was fully developed at day 5, and then started to reduce in size from days 21 to 42. *, p < 0.05 versus a dose of 0.125 mg (H) or day 3 post-injection (I). Scale bar = 100 μm.
FIGURE 2.
FIGURE 2.
Histological investigation of pathological changes after PEG-8 injection. A and B, X-view of the three-dimensional reconstruction of the RPE-choroid flat mounts of PBS- and PEG-8-treated animals, respectively. FITC-dextran-perfused vessels (arrow) are green, and the RPE cells stained with cytokeratin 18 are red. Subretinal tissue, including CNV, is located between two layers of the RPE cells (existing and newly growing). C–E and G, microphotographs of Epon-embedded semithin eye sections (1 μm) of PBS-injected mice (C and E) and PEG-8-injected mice (D and G) killed at day 5 post-injection. Subretinal tissue and CNV are located between two layers of the RPE cells, vessels containing erythrocytes marked with arrows. F, microphotograph of a semithin eye section of PEG-8-injected mice killed at day 1 post-injection showing the increased size of the RPE cells and vacuoles in the RPE cells (arrows). H–K, microphotographs of 5-μm paraffin sections of PBS-injected mice (H) and PEG-8-injected mice killed at day 1 (I), 3 (J), and 5 (K) post-injection. Isolectin IB4-labeled (red) endothelial cells penetrated the Bruch's membrane and growth between the RPE cells (I); endothelial cells proliferated in the subretinal space and formed new vessels partially covered by a new layer of RPE cells (J and K). The nuclei of cells were stained with DAPI (blue). Scale bars = 50 μm (A–D), 20 μm (E–G), and 10 μm (H–K).
FIGURE 3.
FIGURE 3.
Retinal changes after PEG-8 injection. Shown are microphotographs of paraffin sections of PBS-injected (A) and PEG-8-injected (B and C) animals killed at day 5 post-injection stained with hematoxylin and eosin. A decreased thickness of the outer nuclear layer and photoreceptor inner and outer segments was found in PEG-8-treated animals (B and C) compared with PBS-treated controls (A). OLM, outer limiting membrane. Scale bar = 20 μm.
FIGURE 4.
FIGURE 4.
Effect of complement depletion with CVF on PEG-8-induced C9 deposition and CNV size. Intraperitoneal treatment with CVF significantly reduced total complement activity in mouse serum compared with PBS-treated animals (A). C9 deposition (red; B, C, and H) and CNV size (D, E, and I) were significantly reduced in CVF-treated animals. Negative controls with no primary antibodies are also shown (F and G). *, p < 0.05 compared with the PBS-treated group. i.p., intraperitoneal. Scale bar = 100 μm.
FIGURE 5.
FIGURE 5.
Effect of PEG-8 on complement activity in serum and RPE-choroid. A subretinal injection of PEG-8 did not affect total (A) and alternative (B) complement activities in mouse serum at any day post-treatment. Western blot analysis of RPE-choroid tissue showed that PEG-8 increased C3 split products (43 and 23 kDa) at day 1 post-injection (C–E) and C9 at all days post-injection (C and F). b-actin, β-actin. *, p < 0.05.
FIGURE 6.
FIGURE 6.
Immunohistochemical staining for C3 and C9 at sites of CNV induction. Microphotographs of PBS-treated (A–G) and PEG-8-treated (H–N) animals (confocal microscopy) show co-localization of C3 and C9 (yellow; A and H), C3 (green; B and I), control for C3 captured using a red channel (red; C and J), C9 (red; D and K), control for C9 captured using a red channel (red; E and L), and negative controls (no primary antibodies) for C3 (green; F and M) and C9 (red; G and N). A high deposition of C9 and C3 (yellow; H, white brace) on the RPE and choroid in PEG-8-treated animals was observed at the sites of penetration of the Bruch's membrane (BM) by endothelial cells (O–Q) at day 1 post-treatment. Scale bars = 20 μm (A–N) and 50 μm (O–Q).
FIGURE 7.
FIGURE 7.
Effect of PEG-8 on VEGF and other growth factors in the RPE-choroid. Microphotographs of paraffin sections show that PEG-8 increased VEGF expression on the apical side of the RPE and within the choroid (green; D–F) compared with the PBS-treated control (A–C). VEGF ELISA showed significantly increased levels of VEGF in the intracellular fraction of the RPE-choroid at day 3 after PEG treatment (G) and significantly increased levels of VEGF in the extracellular fraction of RPE-choroid at day 5 (H). TGF-β2 ELISA demonstrated significantly increased levels of TGF-β2 in the intracellular fraction at day 1 after PEG treatment (I) and significantly increased levels of TGF-β2 in the extracellular fraction of the RPE-choroid at days 1, 3, and 5 (J). bFGF (FGFb) ELISA showed significantly increased levels of bFGF in the intracellular fraction of the RPE-choroid at day 1, 3, and 5 after PEG treatment (K) and significantly increased levels of bFGF in the extracellular fraction of the RPE-choroid at days 3 and 5 (L). DIC, differential interference contrast. *, p < 0.05 compared with the PBS-treated group. Scale bar = 10 μm.

References

    1. Campochiaro P. A. (2000) J. Cell. Physiol. 184, 301–310 - PubMed
    1. Coleman H. R., Chan C. C., Ferris F. L., 3rd, Chew E. Y. (2008) Lancet 372, 1835–1845 - PMC - PubMed
    1. Zarbin M. A. (2004) Arch. Ophthalmol. 122, 598–614 - PubMed
    1. Montezuma S. R., Vavvas D., Miller J. W. (2009) Semin. Ophthalmol. 24, 52–61 - PubMed
    1. Elizabeth Rakoczy P., Yu M. J., Nusinowitz S., Chang B., Heckenlively J. R. (2006) Exp. Eye Res. 82, 741–752 - PubMed

Publication types

MeSH terms