. 2011 May 13;286(19):17060-8.
doi: 10.1074/jbc.M110.197186. Epub 2011 Mar 14.

Identification of novel ryanodine receptor 1 (RyR1) protein interaction with calcium homeostasis endoplasmic reticulum protein (CHERP)

Affiliations

Identification of novel ryanodine receptor 1 (RyR1) protein interaction with calcium homeostasis endoplasmic reticulum protein (CHERP)

Timothy Ryan et al. J Biol Chem. .

Abstract

The ryanodine receptor type 1 (RyR1) is a homotetrameric Ca(2+) release channel located in the sarcoplasmic reticulum of skeletal muscle where it plays a role in the initiation of skeletal muscle contraction. A soluble, 6×-histidine affinity-tagged cytosolic fragment of RyR1 (amino acids 1-4243) was expressed in HEK-293 cells, and metal affinity chromatography under native conditions was used to purify the peptide together with interacting proteins. When analyzed by gel-free liquid chromatography mass spectrometry (LC-MS), 703 proteins were identified under all conditions. This group of proteins was filtered to identify putative RyR interacting proteins by removing those proteins found in only 1 RyR purification and proteins for which average spectral counts were enriched by less than 4-fold over control values. This resulted in 49 potential RyR1 interacting proteins, and 4 were selected for additional interaction studies: calcium homeostasis endoplasmic reticulum protein (CHERP), endoplasmic reticulum-Golgi intermediate compartment 53-kDa protein (LMAN1), T-complex protein, and phosphorylase kinase. Western blotting showed that only CHERP co-purified with affinity-tagged RyR1 and was eluted with imidazole. Immunofluorescence showed that endogenous CHERP co-localizes with endogenous RyR1 in the sarcoplasmic reticulum of rat soleus muscle. A combination of overexpression of RyR1 in HEK-293 cells with siRNA-mediated suppression of CHERP showed that CHERP affects Ca(2+) release from the ER via RyR1. Thus, we propose that CHERP is an RyR1 interacting protein that may be involved in the regulation of excitation-contraction coupling.


Figures

FIGURE 1.
FIGURE 1.
Expression analysis of the His6 affinity-tagged cytosolic RyR1 rabbit cDNA. HEK-293 cells were transiently transfected with cytosolic RYR1 cDNA using the calcium phosphate protocol. A, confocal microscopy images with antibody raised against RyR1 show that the cytosolic RyR1 construct (amino acids 1–4243) remains in the cytoplasm. B, phase contrast imaging of the same cells shows transfection of HEK-293 cells. C, Coomassie-stained protein gel analysis of wash and elution fractions obtained during the purification of cytosolic RyR1 on Ni-NTA columns shows a purified and concentrated RyR1 band (red arrow) along with potential interacting proteins (black arrows). D, immunoblot analysis of purification products from HEK-293 cells probed with the 34C antibody is shown.
FIGURE 2.
FIGURE 2.
Proteins identified by mass spectrometry from RyR1 purifications. Left, a heat map representation of 703 proteins identified by mass spectrometry in all tandem affinity-purified samples from HEK-293 cells is shown. Color intensities depict total spectral counts (as a function of log 10). Right, shown is a specific cluster from the left heat map, identifying filtered proteins selected in one of two ways; 1) proteins identified in more than one RyR1 experiment and absent from all controls, or 2) Proteins whose average spectral count over all RyR1 experiments exceeded the average spectral count over controls by at least a factor of 4. This resulted in the selection of 49 proteins.
FIGURE 3.
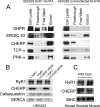
FIGURE 3.
Immunoblot analysis of His6-tagged RyR1 overexpression, CHERP siRNA knockdown, and endogenous expression of RyR1 and CHERP in mouse skeletal muscle. A, fractions analyzed were the cell lysate, the flow-through, or unbound fraction, which is the lysate after incubation with Ni-NTA resin, the final wash, and the fraction eluted with 500 mm imidazole. DHPR, known to interact with RyR1, was used as positive control. B, HEK-293 cells were transfected with full-length RYR1 cDNA 24 h after plating and 2 h later with either blank Lipofectamine (+RyR1) or siRNAs, knocking down either CHERP (+RyR1 + CHERP) or scramble siRNA (+RyR1 + SCRAM). Twenty μg of protein from each sample were run on SDS-PAGE and analyzed by Western blotting. C, WT mouse skeletal muscle was harvested, homogenized, and centrifuged at 8000 rpm to obtain a soluble cell lysate. Twenty μg of protein were run on SDS-PAGE and analyzed by Western blotting to determine endogenous levels of RyR1 and CHERP in WT skeletal muscle.
FIGURE 4.
FIGURE 4.
Subcellular co-localization of CHERP and RyR1 in rat skeletal muscle. A, shown is immunofluorescent analysis of the subcellular distribution of endogenous CHERP and RyR1 in rat soleus skeletal muscle. CHERP was detected by labeling with Alexa 488 (green), and RyR1 was labeled with Alexa 633 (red). Regions of overlap are represented by yellow in the third column. B, three-dimensional reconstruction of a two-dimensional Z-stack of images illustrates the subcellular distribution of endogenous CHERP and RyR1 in rat soleus skeletal muscle (left panel). Analysis of images for three-dimensional colocalization shows that 22% of the voxels within the region of interest seen above were colocalized. Right panel, colocalized voxels only. C, shown is a schematic representation of co-localization between RyR1 and CHERP. D, shown is a three-dimensional reconstruction of a two-dimensional Z-stack of images illustrating the subcellular distribution of endogenous RyR1 and DHPR in mouse soleus skeletal muscle (left panel). Analysis of images for three-dimensional colocalization showed that 28% of the voxels within the region of interest seen above were colocalized. Right panel, colocalized voxels only.
FIGURE 5.
FIGURE 5.
Effect on RyR1-mediated Ca2+ release in HEK-293 cells after knocking down CHERP levels by introduction of siRNAs. HEK-293 cells were transfected with full-length RYR1 cDNA (+RyR1) or siRNAs knocking down either CHERP (+RyR1 - CHERP), or scramble siRNA (+RyR1Scramble), which does not knock down any protein (see “Experimental Procedures”). Ca2+ photometry was carried out using a dual monochromator to provide activating light at 340 or 380 nm combined with reading of emission at 510 nm. Measurements were made every 3 s over a period of 60 s after the addition of caffeine to 5 mm caffeine ∼30 s after readings commenced. All values were normalized by dividing by the base-line value. A, 340/380 ratio for Ca2+ transients of HEK-293 cells expressing RyR1 show that lowered CHERP levels induce a marked decrease in the amplitude of the Ca2+ transient when the cells were stimulated with caffeine. B, the percentage increase of the 340/380 nm ratio over base-line values after the addition of 5 mm caffeine was calculated; after siRNA knockdown of CHERP, Ca2+ release was significantly reduced (*, p ≤ 0.05). C, dose-response curves were obtained by Ca2+ photometry of HEK-293 cells transfected with wild type RYR1 cDNA or with wild-type RYR1 cDNA followed by transfection with CHERP or scrambled siRNA. The amplitude of each peak caffeine response was normalized to the amplitude of the peak caffeine response. Changes in fluorescence ratio are presented as Δr = (RRmin)/(RmaxRmin), where R refers to the 340/380 nm fluorescence ratio at each caffeine concentration, and Rmin and Rmax refer to the fluorescence ratio under resting conditions and at the highest response to caffeine. R is plotted as a function of caffeine concentration. Upon stimulation with 12 mm caffeine, the upper limit of RyR1 caffeine response, there was a significant reduction in fluorescence response in cells suppressing CHERP (*, p ≤ 0.05).

Similar articles

Cited by

References

    1. Berchtold M. W., Brinkmeier H., Müntener M. (2000) Physiol. Rev. 80, 1215–1265 - PubMed
    1. Loke J., MacLennan D. H. (1998) Am. J. Med. 104, 470–486 - PubMed
    1. MacLennan D. H., Phillips M. S. (1992) Science 256, 789–794 - PubMed
    1. MacLennan D. H. (2000) Eur. J. Biochem. 267, 5291–5297 - PubMed
    1. MacLennan D. H., Kranias E. G. (2003) Nat. Rev. Mol. Cell Biol. 4, 566–577 - PubMed

Publication types

MeSH terms