. 2011 May 13;286(19):17248-58.
doi: 10.1074/jbc.M110.195198. Epub 2011 Mar 25.

Retinyl ester storage particles (retinosomes) from the retinal pigmented epithelium resemble lipid droplets in other tissues

Affiliations

Retinyl ester storage particles (retinosomes) from the retinal pigmented epithelium resemble lipid droplets in other tissues

Tivadar Orban et al. J Biol Chem. .

Abstract

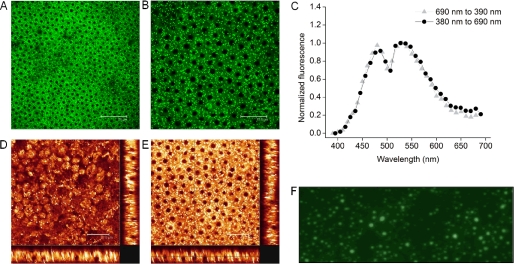
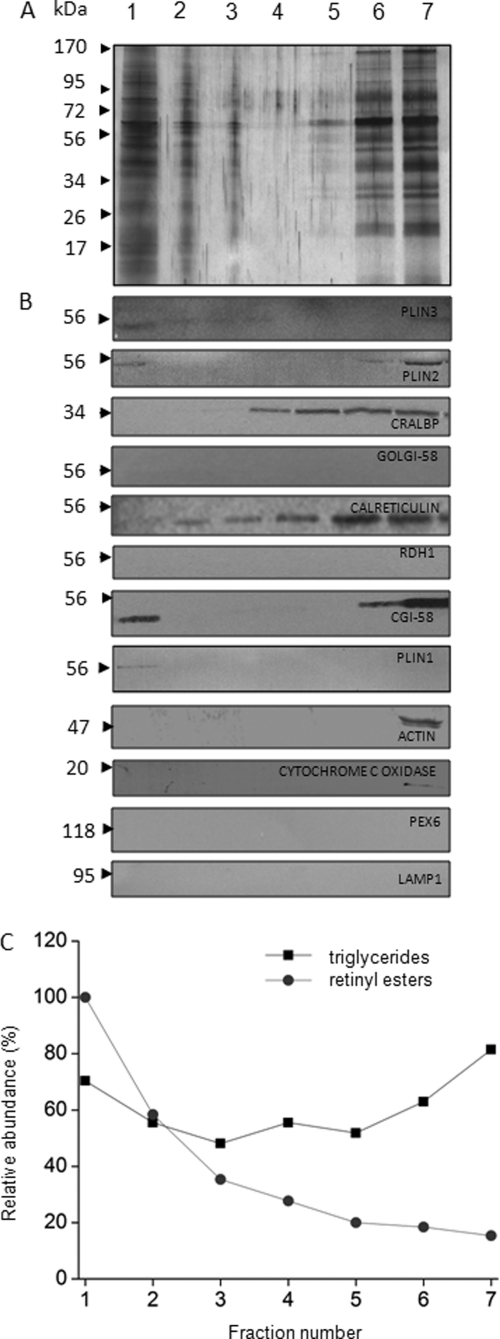
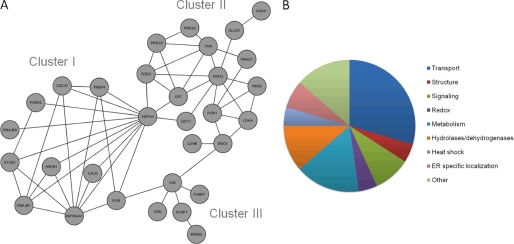
Levels of many hydrophobic cellular substances are tightly regulated because of their potential cytotoxicity. These compounds tend to self-aggregate in cytoplasmic storage depots termed lipid droplets/bodies that have well defined structures that contain additional components, including cholesterol and various proteins. Hydrophobic substances in these structures become mobilized in a specific and regulated manner as dictated by cellular requirements. Retinal pigmented epithelial cells in the eye produce retinyl ester-containing lipid droplets named retinosomes. These esters are mobilized to replenish the visual chromophore, 11-cis-retinal, and their storage ensures proper visual function despite fluctuations in dietary vitamin A intake. But it remains unclear whether retinosomes are structures specific to the eye or similar to lipid droplets in other organs/tissues that contain substances other than retinyl esters. Thus, we initially investigated the production of these lipid droplets in experimental cell lines expressing lecithin:retinol acyltransferase, a key enzyme involved in formation of retinyl ester-containing retinosomes from all-trans-retinol. We found that retinosomes and oleate-derived lipid droplets form and co-localize concomitantly, indicating their intrinsic structural similarities. Next, we isolated native retinosomes from bovine retinal pigmented epithelium and found that their protein and hydrophobic small molecular constituents were similar to those of lipid droplets reported for other experimental cell lines and tissues. These unexpected findings suggest a common mechanism for lipid droplet formation that exhibits broad chemical specificity for the hydrophobic substances being stored.


Figures

FIGURE 1.
FIGURE 1.
Fluorescence microscopy of oleic acid- and all-trans-retinol-treated cell lines. Experimental cell lines readily formed lipid droplets following treatment with oleate or all-trans-retinol. Cells were seeded at 1 million cells/plate. Three independent experiments were performed, each with seven plates. A shows lipid droplet images after treatment of ARPE19, NIH3T3, NIH3T3/L, and NIH3T3/RL cells with either oleate (100 μm) or all-trans-retinol (10 and 20 μm). B shows the lipid droplet area per cell for all five cell lines depicted in A. Quantification was accomplished with NIH Image J. software. Statistical analyses were performed with a one-tail, type 2 t test. Data shown represent means ± S.D. Their significance is denoted as follows: *, p < 0.05; **, p < 0.005. C indicates the time course of lipid droplet appearance in NIH3T3 cells following treatment with 10 μm all-trans-retinol. Arrows indicate the position of lipid droplets. The results demonstrate that lipid droplets are formed next to the plasma membranes, not only after oleate treatment but also after exposure to all-trans-retinol and retinyl esters.
FIGURE 2.
FIGURE 2.
Fluorescence microscopy of NIH3T3 cells. NIH3T3 cells evidenced net formation of heterogeneous lipid droplets following incubation at 37 °C with oleate and all-trans-retinol. Cells were seeded at 1 million cells/plate. Three independent experiments were done, each with seven plates. A shows images of NIH3T3 cells after treatment with 10 μm all-trans-retinol for the first 24 h followed by a mixture of oleate (100 μm) and all-trans-retinol (10 μm) for another 24 h at 37 °C. A, panel a depicts the resulting UV-all-trans-retinol image, and panel b reveals lipid droplets stained with BODIPY493/503. The merged figure is seen in panel c. B demonstrates the fluorescence of NIH3T3 cells treated with oleate on the 1st day and a mixture of oleate and all-trans-retinol on the 2nd day, i.e. the reverse of the A protocol. B, panel a shows both UV imaging for all-trans-retinal and nuclear staining with DAPI, and panel b depicts staining with the lipid droplet marker PLIN2. Panel c displays the overlaid image of panels a and b. C exhibits NIH3T3 cells treated as described for B. C, panel a shows lipid droplets stained with BODIPY493/503, and panel b shows staining with the lysosomal marker LAMP1. Panel c is the merged image. Arrows indicate lipid droplets. The results demonstrate that all-trans-retinol and PLIN2 co-localize in lipid droplets, whereas all-trans-retinol and the lysosomal marker LAMP1 do not.
FIGURE 3.
FIGURE 3.
Retinyl ester analyses following treatment of cell cultures with 10 μm all-trans-retinol. Following treatment with 10 μm all-trans-retinol, cell homogenates were processed as described under “Materials and Methods.” The HPLCs shown are representative of triplicate experiments wherein each experiment involved 1 plate with 1 million cells. HPLCs of treated cells are depicted in solid black lines, and those of untreated cell lines are shown as dashed lines. A shows ARPE19; B shows NIH3T3; C shows NIH3T3/L, and D shows NIH3T3/RL cell chromatograms. Retinyl esters with elution times ranging from 10 to 20 min were detected only in NIH3T3/L and NIH3T3/RL cell homogenates. Insets show TLCs of triglycerides in lipid droplets isolated from untreated cells and cells treated with all-trans-retinol. The results demonstrate that the lipid droplet composition differs in the LRAT-expressing cell lines and that all-trans-retinol induces triglyceride formation in ARPE19 and NIH3T3 cell lines.
FIGURE 4.
FIGURE 4.
Retinosomes in bovine RPE. A displays a large field TPM image of bovine RPE obtained from a fresh eye with the white scale bar set to 75 μm. B shows a TPM image of subcellular structures in fresh bovine RPE. Plasma membranes of cells are visible as faint black lines, and nuclei are seen as black filled circles, whereas bright fluorescent spots indicate retinosomes; scale bar, 37.5 μm. C illustrates the normalized fluorescence spectrum obtained as a function of wavelength upon scanning back from 690 to 390 nm (▴) and forward from 380 to 690 nm (●). D, main box displays an en face TPM image of the apical side of the RPE. The two transverse images, one shown at the bottom and one at the right edge, were assembled from a series of z slice images. Scale bar was set to 37.5 μm. E, main box displays an en face TPM image of the RPE with light focused close to the center of the nuclei; the two transverse images were obtained as described in D. The scale bar was set to 37.5 μm. F shows a microscopic fluorescent image of the fraction 1 fatty layer stained with BODIPY493/503. Pictures are representative snapshots of experiments performed in triplicate. The results demonstrate that bovine RPE cells contain bright fluorescent retinosomes, and the lipid droplets purified from the REP homogenates are similar to those imaged in vivo.
FIGURE 5.
FIGURE 5.
Analysis of retinosomes from bovine RPE. Shown here are chromatograms of in vivo purified retinosomes with absorbance measured at 325 nm together with the retinyl ester content of the collected fractions 1–7. These fractions were obtained by sucrose gradient centrifugation of bovine RPE homogenates and analyzed by MS. Chromatograms shown are representative of triplicate experiments. A, features an HPLC analysis of retinyl esters from the seven fractions. B indicates the relative absorbance at 326 nm as a function of elution time (min), and C shows the representative ion m/z = 269 characteristic of retinol and retinyl esters. The mass spectrometry analysis was performed on fraction 1. The results demonstrate that lipid droplets isolated from RPE homogenates contain retinyl esters.
FIGURE 6.
FIGURE 6.
Purification of retinosomes from bovine RPE. The purity of retinosomes obtained from bovine RPE was assessed based on both the detection of lipid droplet proteins in the top sucrose gradient fraction (fraction 1) and the absence of contaminating proteins such as calreticulin, CRALBP, actin, cytochrome c oxidase, PEX6, LAMP1, RDH1, and Golgi-58 from this fraction. Yet another criterion was the increased level of retinyl esters found in the top fraction. Images are representative of experimental triplicates. A shows SDS-PAGE of fractions collected after sucrose step centrifugation (Coomassie Blue stain). Fractions are labeled 1–7, and the lane with molecular markers indicates the molecular mass in kDa. B displays immunoblots of these collected fractions. Fraction 1 contained a notable level of CGI-58 with lesser amounts of PLIN3, PLIN2 and PLIN1. C shows the relative abundance of retinyl esters (●) and triglycerides (■) in the collected fractions. Levels of retinyl esters were highest in fraction 1, and triglycerides were broadly distributed. The results demonstrate that the protein composition of fraction 1 containing lipid droplets is different from the other fractions, and some of these proteins were previously identified in lipid droplet preparations from a variety of cell lines. Lipid droplets isolated from RPE homogenates show that retinyl esters are not the only components but that triglycerides are present as well.
FIGURE 7.
FIGURE 7.
Proteins recruited into retinosomes. By investigating the protein composition of purified bovine retinosomes, we found proteins involved in transport, metabolism, and structure, among others. A shows the interactive network of proteins found to be localized to retinosomes. The node labels represent gene names described in supplemental Table S1. B shows a diagram summarizing the functions of proteins localized to retinosomes. The results indicate the diversity of proteins recruited on the retinosome.

References

    1. Uhlenhuth E. (1916) J. Exp. Med. 24, 689–699 - PMC - PubMed
    1. Kevany B. M., Palczewski K. (2010) Physiology 25, 8–15 - PMC - PubMed
    1. Bok D. (1993) J. Cell Sci. Suppl. 17, 189–195 - PubMed
    1. Flannery J. G., O'Day W., Pfeffer B. A., Horwitz J., Bok D. (1990) Exp. Eye Res. 51, 717–728 - PubMed
    1. von Lintig J., Kiser P. D., Golczak M., Palczewski K. (2010) Trends Biochem. Sci. 35, 400–410 - PMC - PubMed

Publication types

LinkOut - more resources