. 2011 May 20;286(20):18301-10.
doi: 10.1074/jbc.M110.215707. Epub 2011 Mar 26.

The human adenocarcinoma-associated gene, AGR2, induces expression of amphiregulin through Hippo pathway co-activator YAP1 activation

Affiliations

The human adenocarcinoma-associated gene, AGR2, induces expression of amphiregulin through Hippo pathway co-activator YAP1 activation

Aiwen Dong et al. J Biol Chem. .

Abstract

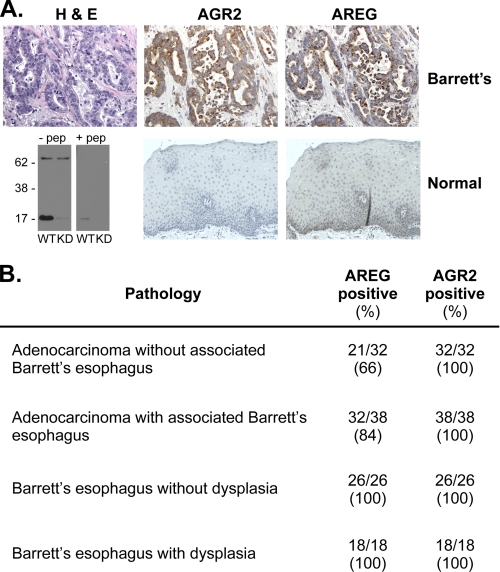
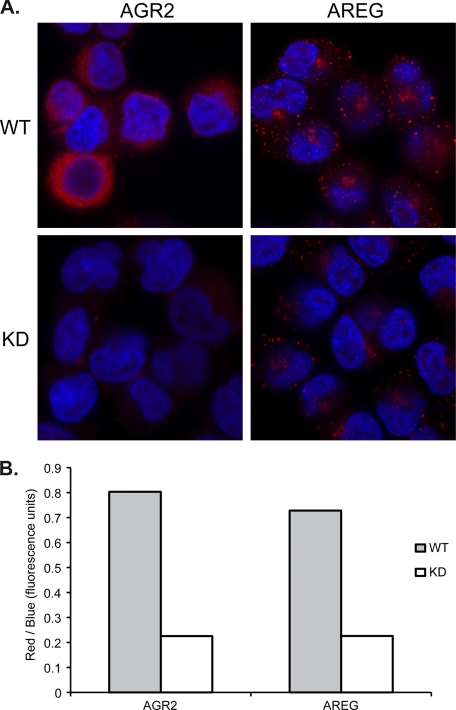
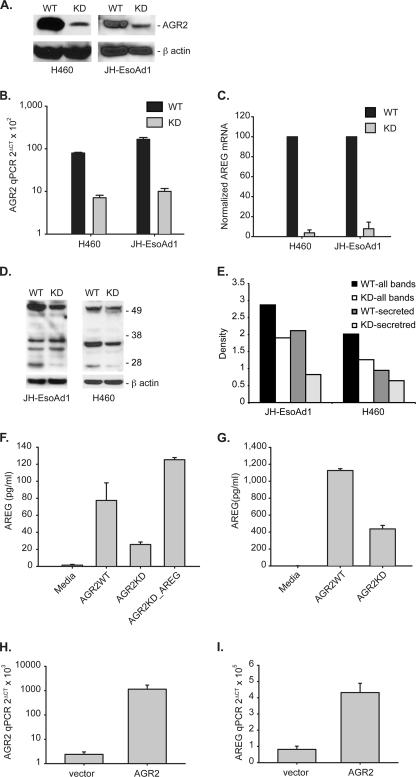
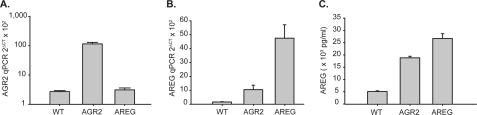
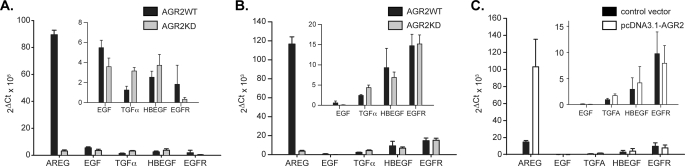
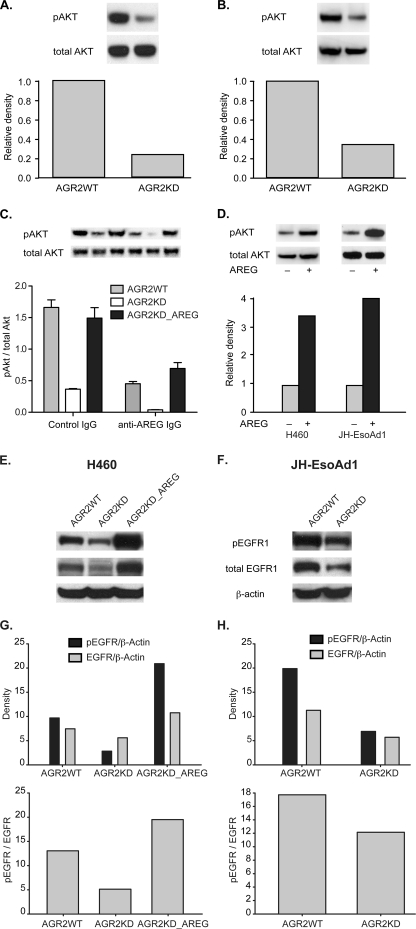
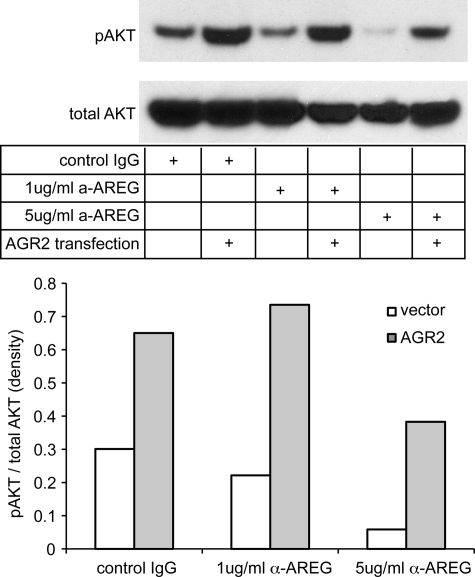
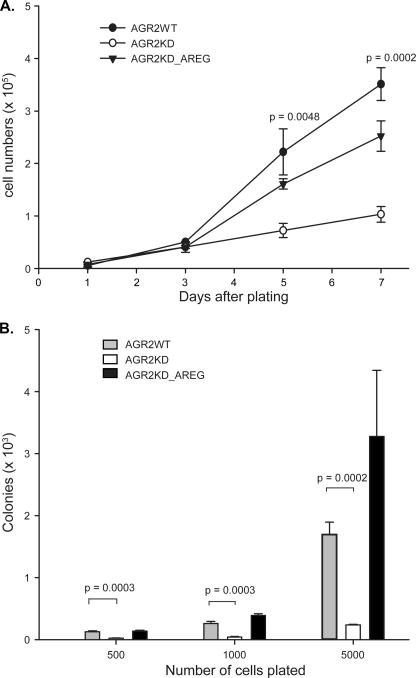
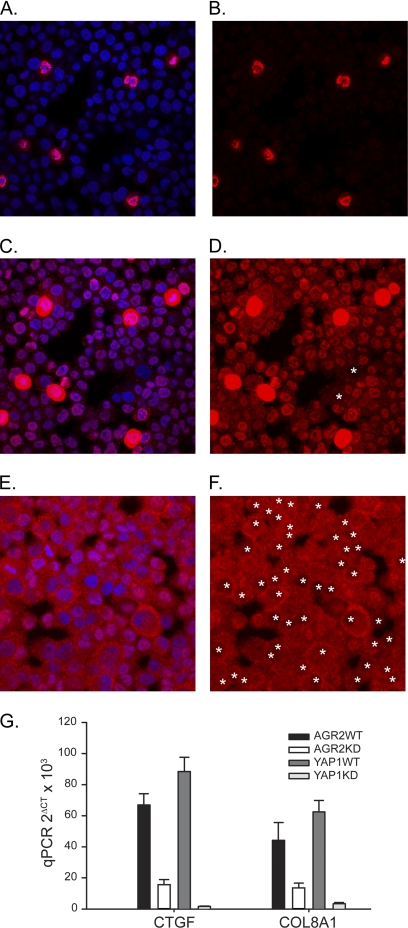
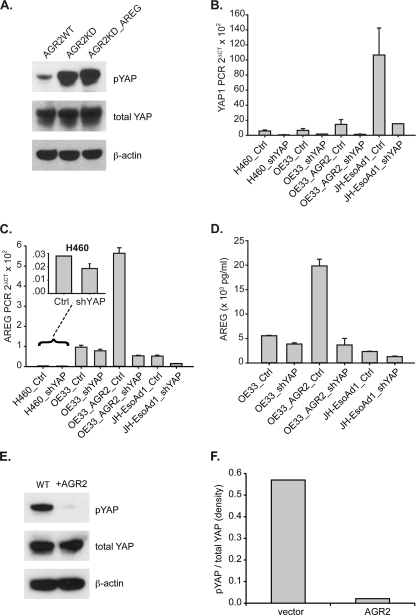
Anterior Gradient Homolog 2 (AGR2) is expressed by the normal intestine and by most human adenocarcinomas, including those derived from the esophagus, pancreas, lung, breast, ovary, and prostate. Xenografts of human adenocarcinoma cell lines in nude mice previously demonstrated that AGR2 supports tumor growth. In addition, AGR2 is able to induce in vitro a transformed phenotype in fibroblast and epithelial cell lines. The mechanism underlying the growth promoting effects of AGR2 is unknown. The present study shows that AGR2 induces expression of amphiregulin (AREG), a growth promoting EGFR ligand. Induced AREG expression in adenocarcinoma cells is able to rescue the transformed phenotype that is lost when AGR2 expression is reduced. Additional experiments demonstrate that AGR2 induction of AREG is mediated by activation of the Hippo signaling pathway co-activator, YAP1. Thus AGR2 promotes growth by regulating the Hippo and EGF receptor signaling pathways.


Figures

FIGURE 1.
FIGURE 1.
AGR2 and AREG protein are expressed in esophageal adenocarcinoma cells. A, serial sections of esophageal adenocarcinoma (top row) stained with hematoxylin and eosin, or immunoperoxidase after probing with AGR2 or AREG specific antisera. (second row) Immunohistochemistry of normal esophageal tissues and a protein immunoblot of JH-EsoAd1 esophageal adenocarcinoma cells to characterize the anti-AGR2 antisera. The blots consisted of WT and AGR2 RNAi KD JH-EsoAd1 cells in the absence or presence of the antigenic peptide. There is a 72-kDa cross-reactive band that does not change in the knockdown cells. B, results of staining serial sections derived from a tissue microarray containing human Barrett's esophagus and esophageal adenocarcinomas. The images may be viewed at Stanford Tissue Microarray Consortium Web Portal (array block TA-304 and TA-305). See supplement S2 for scoring of the staining intensity.
FIGURE 2.
FIGURE 2.
Clonal H460 cells express both AGR2 and AREG. Reduction of AGR2 expression results in decreased AREG protein. Immunofluorescence studies for AGR2 and AREG protein in vector control WT or AGR2 RNAi KD H460 cells. The cells were all processed for immunofluorescence at the same time under identical conditions. The images were acquired under identical conditions for each antibody (AGR2 or AREG) with no post-image processing performed. The fluorescence intensity for AGR2 and AREG (red) was measured using ImageJ and normalized for cell number using the blue (DAPI) fluorescence.
FIGURE 3.
FIGURE 3.
AGR2 regulates AREG RNA and protein expression. A, protein immunoblots for AGR2 of cell lysates derived from H460 and JH-EsoAd1 cells after AGR2 knockdown yielding H460-AGR2KD and JH-EsoAd1-AGR2KD cells. β-Actin served as a loading control. WT, infected with the vector alone. B, log plot of AGR2 mRNA qPCR in AGR2 WT and KD H460 and JH-EsoAd1 cells. Values are normalized to β-actin mRNA. H460-AGR2WT versus H460-AGR2KD, p < 0.0001; JH-EsoAd1-AGR2WT versus JH-EsoAd1-AGR2KD, p = 0.0001. C, AREG mRNA expression in AGR2 wild type and knockdown cells. Mean qPCR values (n = 3) were adjusted such that WT cells equaled 100. H460-AGR2WT versus H460-AGR2KD, p < 0.0001; JH-EsoAd1-AGR2WT versus JH-EsoAd1-AGR2KD, p < 0.0001. D, immunoblots of whole cell lysates for cell-associated AREG in H460 cells and JH-EsoAd1 cells. The dominant immunoreactive bands include proAREG at 50 kDa and the processed form at 26kDa, both of which are secreted. The remaining bands between 26–50 kDa represent intracellular intermediates of AREG protein (18, 51, 52). E, scanning densitometry was performed for all AREG immunoreactive bands for H460 and JH-EsoAd1 cells and quantified using ImageJ. The results were normalized with β-actin. Shown in E are the densitometric results using all immunoreactive bands, or only the secreted 50 and 26 kDa bands. F and G, ELISA assay for secreted AREG in the culture media for WT and KD H460 (F) (p < 0.0001) and JH-EsoAd1 cells (G) (p < 0.0001). Statistical comparisons between the values utilized one-way ANOVA. Also shown is the effect of induced AREG expression by transfection in H460_AGR2KD cells (F, column 4). Values represent the mean of three independent experiments. AREG levels in the culture media alone were assayed as a control. H and I, controls where AGR2 expression is restored in H460_AGR2KD cells through transfection with AGR2 cDNA in which the 3′-untranslated region is truncated before the binding site for the shRNAi. Both AGR2 (H) and AREG (I) mRNA were assessed with qPCR in H460_AGR2KD cells transfected with vector or AGR2 cDNA.
FIGURE 4.
FIGURE 4.
AGR2 overexpression induces AREG, but AREG expression does not affect AGR2 in OE33 esophageal adenocarcinoma cells. A, log scale plot of qPCR for AGR2; B, qPCR for AREG; WT, wild-type; AGR2, AGR2 overexpression; AREG, AREG overexpression in OE33 cells. C, ELISA of AREG in the culture media. Error bars represent ± 1 S. D. (n = 3).
FIGURE 5.
FIGURE 5.
Effects of AGR2 expression on EGFR and other EGFR ligands. RNA quantification by qPCR of EGF, TGFα, HBEGF, and EGFR in H460 (A) and JH-EsoAd1 (B) cells with (WT) and without (KD) reduced AGR2 expression. C, AREG, EGF, TGFα, HBEGF, and EGFR mRNA levels after AGR2 overexpression in OE33 cells. BTC, EPREG, and EPNG were not detectable and are not shown. Control OE33 cells were transfected with pcDNA3.1-GFP. The insets contain an expanded image for EGF, TGFα, HBEGF, and EGFR. All values in the figure were normalized to β-actin. Error bars represent ± 1 S. D. (n = 3).
FIGURE 6.
FIGURE 6.
AGR2 regulates EGFR and AKT phosphorylation through AREG. A and B, immunoblots of total and phosphorylated AKT in H460 (A) and JH-EsoAd1 (B) cell lysates (8 μg). Cell lysates were derived from control (WT) and AGR2 KD cells. Shown is one representative blot of three independent experiments. The quantified relative densities are shown below the blots and represent the pAKT/total AKT ratio normalized to wild-type cells, which is set at 1.0. C, pAKT/total AKT ratio as determined by protein immunoblotting of H460 cells as noted. Cells were serum starved for 48 h followed by treatment with either 1 μg/ml of anti-AREG IgG or control rabbit IgG for 2 h. The values represent the mean ± 1 S. D. of three independent experiments. Statistical significance between the presence of anti-AREG antibodies and the cell line used (WT, KD, or AREG overexpression) were analyzed by two-way ANOVA (p = 0.0090). D, AREG rescue of AGR2 knockdown. Immunoblots of total and phosphorylated AKT without (−) and with (+) AREG overexpression by cDNA transfection of H460-AGR2KD (left) and JH-EsoAd1-AGR2KD (right) cells. E and F, protein immunoblots of WT and KD H460 (E) and JH-EsoAd1 (F) cell lysates for phosphorylated and total EGFR. Also included are H460-AGR2KD cells in which AREG was overexpressed by transfection (E). The immunoblots were probed with anti-phosphorylated EGFR, total EGFR, and β-actin antibodies. Shown below the immunoblots are graphs depicting the quantified bands normalized to β-actin. The top graphs represent the density of phosphorylated EGFR and total EGFR normalized to β-actin for H460 (G) and JH-EsoAd1 (H) cells. The bottom graphs represent the pEGFR/total EGFR ratio for the same cells.
FIGURE 7.
FIGURE 7.
AGR2 overexpression results in AKT phosphorylation via enhanced AREG expression. Blocking antibodies were used to determine whether AREG mediated the AGR2-induced AKT phosphorylation in OE33 cells. Two different concentrations of anti-AREG antibodies were applied to OE33 cells with (AGR2) or without (vector) AGR2 overexpression. Protein immunoblotting was then performed on the resultant cell lysates with antisera for either phosphorylated or total AKT. Densitometry was performed of the immunoblots and depicted on the graph as the pAKT/total AKT ratio.
FIGURE 8.
FIGURE 8.
AREG mediates the AGR2 induced transformed phenotype. A, cell proliferation assay of H460 cells AGR2WT, AGR2KD, and AGR2KD_AREG that were cultured in 24-well plates (1 × 10⁴ cells/well) in 0.5 ml of DMEM supplemented with 0.5% FBS. The cells were harvested at the specified time points and manually counted. Each data point represents the mean of three wells; error bars = ± 1 S. D. B, assay of anchorage-independent growth of the same cells as above. Cells are plated in soft agar at different initial densities and assessed for colony number after 2 weeks. Column height represents the mean colony number from three different dishes; error bars, ±1 S.D.
FIGURE 9.
FIGURE 9.
AGR2 expression induces YAP1 nuclear localization and the expression of YAP1 targets. Wild-type H460 (A–D) and H460_AGR2KD (E and F) cells labeled with anti-YAP1 antibodies (red) or DAPI nuclear stain (blue). Panels A, C, and E display both the red and blue channels, whereas panels B, D, and F display only the red channel. Panels A–D all represent the same cells except that the images acquired for panels C and D were obtained at a higher gain in the red channel to reveal subcellular YAP1 distribution in cells with lower expression. Panels E and F represent H460_AGR2KD cells with reduced AGR2 expression. The contrast was enhanced in panels E and F to facilitate determination of the YAP1 subcellular distribution. The white asterisks in panels D and F denote cells with predominant cytoplasmic YAP1 localization. There are 190 cells as determined by DAPI nuclear staining in panels A–D and 159 cells in panels E and F. G, qPCR of YAP1 targets in H460 cells with (KD) or without (WT) AGR2 knockdown or in control cells without (YAP1WT) or with YAP1 knockdown (YAP1KD).
FIGURE 10.
FIGURE 10.
AGR2 induces AREG expression through YAP1. A, immunoblotting with isoform-specific antibodies for phosphorylated and total YAP1 protein in H460 cells. The H460 cells shown include controls (WT), AGR2 KD, and AGR2-KD_AREG cells where AREG is overexpressed after transfection. B, qPCR of YAP1 after expression of YAP1-specific shRNAmir in H460, OE33, and JH-EsoAd1 cells. Before qPCR was performed, the cells were FACS sorted for high GFP expression. OE33_AGR2 represent cells transfected with AGR2 cDNA. C, qPCR of AREG using the same cells as in panel B. D, ELISA for AREG protein in the tissue culture media of OE33 and JH-EsoAd1 cells. H460, OE33, and JH-EsoAd1 cells were FACS-sorted for GFP expression 72 h after RNAi exposure followed by another 48 h in culture before the media was collected for the AREG ELISA assay. E, protein immunoblotting of OE33 cell lysates for phosphorylated and total YAP1, and β-actin with and without AGR2 overexpression. F, plots derived from densitometry of the protein immunoblots (E) quantified with ImageJ.

Similar articles

Cited by

References

    1. Aberger F., Weidinger G., Grunz H., Richter K. (1998) Mech. Dev. 72, 115–130 - PubMed
    1. Kumar A., Godwin J. W., Gates P. B., Garza-Garcia A. A., Brockes J. P. (2007) Science 318, 772–777 - PMC - PubMed
    1. Wang Z., Hao Y., Lowe A. W. (2008) Cancer Res. 68, 492–497 - PubMed
    1. Hao Y., Triadafilopoulos G., Sahbaie P., Young H. S., Omary M. B., Lowe A. W. (2006) Gastroenterology 131, 925–933 - PMC - PubMed
    1. Lowe A. W., Olsen M., Hao Y., Lee S. P., Taek Lee K., Chen X., van de Rijn M., Brown P. O. (2007) PLoS ONE 2, e323. - PMC - PubMed

Publication types

MeSH terms