. 2011 May 27;286(21):18492-504.
doi: 10.1074/jbc.M110.189811. Epub 2011 Mar 26.

Rap1-GTP-interacting adaptor molecule (RIAM) protein controls invasion and growth of melanoma cells

Affiliations

Rap1-GTP-interacting adaptor molecule (RIAM) protein controls invasion and growth of melanoma cells

Pablo Hernández-Varas et al. J Biol Chem. .

Abstract

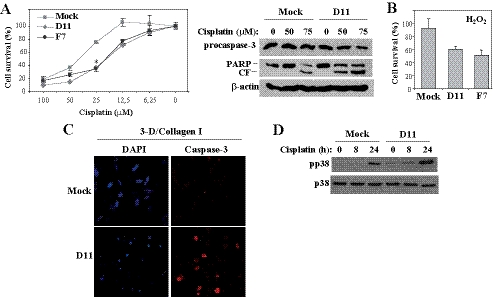
The Mig-10/RIAM/lamellipodin (MRL) family member Rap1-GTP-interacting adaptor molecule (RIAM) interacts with active Rap1, a small GTPase that is frequently activated in tumors such as melanoma and prostate cancer. We show here that RIAM is expressed in metastatic human melanoma cells and that both RIAM and Rap1 are required for BLM melanoma cell invasion. RIAM silencing in melanoma cells led to inhibition of tumor growth and to delayed metastasis in a severe combined immunodeficiency xenograft model. Defective invasion of RIAM-silenced melanoma cells arose from impairment in persistent cell migration directionality, which was associated with deficient activation of a Vav2-RhoA-ROCK-myosin light chain pathway. Expression of constitutively active Vav2 and RhoA in cells depleted for RIAM partially rescued their invasion, indicating that Vav2 and RhoA mediate RIAM function. These results suggest that inhibition of cell invasion in RIAM-silenced melanoma cells is likely based on altered cell contractility and cell polarization. Furthermore, we show that RIAM depletion reduces β1 integrin-dependent melanoma cell adhesion, which correlates with decreased activation of both Erk1/2 MAPK and phosphatidylinositol 3-kinase, two central molecules controlling cell growth and cell survival. In addition to causing inhibition of cell proliferation, RIAM silencing led to higher susceptibility to cell apoptosis. Together, these data suggest that defective activation of these kinases in RIAM-silenced cells could account for inhibition of melanoma cell growth and that RIAM might contribute to the dissemination of melanoma cells.


Figures

FIGURE 1.
FIGURE 1.
CXCL12-promoted melanoma cell invasion is dependent on Rap1. A, BLM melanoma cells were incubated with or without CXCL12 and subsequently subjected to Rap1 GTPase assays. Numbers below the gel represent densitometer analyses in arbitrary units. B, BLM cells were transfected with control (Ctrl) or the indicated Rap1A siRNA, and transfectants were analyzed by immunoblotting with anti-Rap1 antibodies (left panel) or tested in invasion assays across Matrigel in response to CXCL12 (right panel). C, cells were transfected with pSuper or pSuper-Rap1A vectors, and transfectants were analyzed by immunoblotting (left panel) or subjected to invasion assays (right panel). D, BLM cells were transfected with wild type Rap1 (Rap1 wt), constitutively active Rap1 (Rap1 CA), or empty vectors (Mock), and transfectants were analyzed by Western blotting with anti-Rap1 or anti-HA antibodies (left panel) or subjected to invasion assays across Matrigel (right panel). ***, invasion was significantly inhibited, p < 0.001; **, p < 0.01, or *, p < 0.05. All invasion experiments were done with duplicate samples. (B, n = 4; C, n = 3). ΔΔInvasion was up-regulated compared with invasion by mock cells, p < 0.01 (n = 2). Anti-β-actin antibodies were used to control protein loading in Western blots.
FIGURE 2.
FIGURE 2.
RIAM is required for melanoma cell invasion. A, immunohistochemical analysis of RIAM expression on melanoma lymph node metastasis. Sections were stained with the melanoma-specific marker HMB-45 (tumor) or with anti-RIAM antibodies or with DAPI to visualize nuclei. Sample 82 is shown. Additional analyses of melanoma specimens are shown in supplemental Fig. S1. B, lysates from BLM cells exposed for 15 min to CXCL12 were incubated with GST or GST-Ral-GDS, and bound Rap1 and RIAM were detected by immunoblotting. C, expression of RIAM in untransfected BLM cells, and in Mock and stable RIAM knockdown transfectants (D11 and F7), was analyzed by immunoblotting with anti-RIAM antibodies (top panel). Numbers below the gel represent densitometer analyses in arbitrary units. Bottom panel, transfectants were tested in invasion assays across Matrigel. D, BLM cells were transfected with control or with the indicated RIAM siRNA, and transfectants were analyzed by immunoblotting (top panel) or subjected to invasion assays (bottom panel). E, BLM cells were transfected with His- or Myc-tagged RIAM vectors, and transfectants were analyzed by immunoblotting to determine RIAM-His or RIAM-myc expression (left panel) or subjected to invasion assays (right panel). F, mock and D11 cells were transfected with control or RIAM-His vectors, and their invasion to CXCL12 was compared with that of mock cells. G, BLM cells were transfected with the indicated siRNA together with Rap1 CA, RIAM-His, or mock vectors. Transfectants were analyzed by immunoblotting (top panel) or tested in invasion assays (bottom panel). (C, n = 5; D, n = 3; E, n = 3; F, n = 2; G, n = 2.) ***, invasion was significantly inhibited, p < 0.001; **, p < 0.01; ΔΔΔ, invasion was up-regulated compared with invasion by mock transfectants, p < 0.001; ΔΔ, p < 0.01; Δ, p < 0.05. Anti-β-actin antibodies were used to control protein loading in Western blots.
FIGURE 3.
FIGURE 3.
Directional persistence of migration is deficient in RIAM-silenced melanoma cells. A, transfectants in culture were tested in wound healing assays in the presence of CXCL12 (50 ng/ml). A representative result from three experiments is shown. B, transfectants were subjected to time-lapse microscopy experiments on Matrigel. CXCL12 (150 ng/ml) was added on the top reservoir of chambers, and migration of individual cells (n = 15) was tracked and represented in micrometers (x and y axis) using a common starting point in the middle of the graph. Shown is a representative result of three independent experiments. EMD, Euclidean mean distance. C, cells were transfected with DsRed-paxillin, and membrane protrusions were analyzed for the indicated times by time-lapse microscopy. Shown are two representative individual cells from each mock and D11 transfectant.
FIGURE 4.
FIGURE 4.
Impaired invasion of RIAM-silenced melanoma cells involves defective Vav2-RhoA-ROCK-MLC activation. A, mock or D11 cells were incubated for the indicated times with CXCL12 and subjected to immunoprecipitation (IP) with anti-Vav2 antibodies, followed by immunoblotting with the indicated antibodies. Numbers below the gel represent densitometer analyses in arbitrary units showing Vav2 tyrosine phosphorylation levels. B–D, cells were tested for GTPase assays to detect active RhoA (B) or analyzed by Western blotting for phospho-MYPT1 (C) or for phospho-MLC or total MLC expression (D). E, mock and D11 cells were transfected with GFP-fused wild type (wt) or constitutively active (CA) forms of Vav2, and transfectants were analyzed by immunoblotting with anti-Vav2 antibodies (top panel) or subjected to RhoA GTPase and invasion assays (middle and bottom panels, respectively). F, mock and D11 cells were transfected with GFP-fused wild type (wt) or constitutively active (CA) forms of RhoA, and transfectants were analyzed by immunoblotting with anti-RhoA antibodies (left panel) or tested in invasion assays (right panel). ΔΔ, invasions of D11-Vav2 CA or D11-Rho CA transfectants were significantly higher than D11-Vav2 WT or D11-Rho WT cells, respectively, p < 0.01.
FIGURE 5.
FIGURE 5.
RIAM-silenced melanoma cells have reduced talin β1 integrin association and defective β1 integrin-mediated adhesion. A, transfectants were subjected to immunoprecipitation (IP) with control (Ctr) or Lia 1/2.1 anti-β1 antibodies, followed by immunoblotting with anti-talin or anti-β1 antibodies. B, mock or D11 cells were transfected with control or RIAM-His vectors and subjected to immunoprecipitation and Western blotting as in A. Total talin loading is also shown. C and D, transfectants were tested in adhesion assays (10 min, 37 °C) to fibronectin or type I collagen, in the presence of control or Lia 1/2.1 anti-β1 mAb. Basal adhesion to BSA is also displayed. ***, adhesion was significantly inhibited, p < 0.001; **, p < 0.01; or *, p < 0.05; or stimulated Δ, p < 0.05 (n = 4).
FIGURE 6.
FIGURE 6.
RIAM-silenced melanoma cells have defective Erk1/2 and Akt activation. A, cells were incubated for the indicated times with CXCL12 and subsequently subjected to Ras GTPase assays. B and C, transfectants were plated for the indicated times on fibronectin or collagen I, and following cell lysis, extracts were subjected to Western blotting with antibodies to phospho-Erk1/2, Erk1/2, phospho-Akt, or Akt. D, mock and D11 cells were transfected with control or RIAM-His vectors and subsequently analyzed by immunoblotting with phospho-Erk1/2 and Erk1/2 antibodies. E, transfectants were starved for 8 h and subsequently incubated for the indicated times with EGF (10 ng/ml) or IGF-1 (100 ng/ml). Cells were then lysed and subjected to immunoblotting using anti-Erk1/2 or anti-Akt antibodies.
FIGURE 7.
FIGURE 7.
RIAM silencing in melanoma leads to inhibition of tumor growth and delayed metastasis. A, SCID mice were subcutaneously inoculated with the indicated melanoma BLM transfectants. Data show the correlation between days post-inoculation and percentage of mice with tumors (left panel) or tumor-free mice (right panel). B, shown are survival curves of SCID mice intravenously inoculated with the indicated melanoma transfectants (***, survival was significantly higher than mice inoculated with mock transfectants, p < 0.001). C, displayed are representative fields of anchorage-independent colony formation on soft agar (left panel), and quantification in mean colony numbers (right panel, n = 3; duplicates). Only colonies larger than 50 μm were counted. D, cell proliferation was determined using the 3-(4,5-dimethylthiazol-2-yl)-2,5-diphenyltetrazolium bromide (MTT) assay (left panel). *, proliferation was inhibited, p < 0.05, or augmented; ΔΔΔ, p < 0.001 (n = 4). Right panel, cells (5 × 10³) were cultured in complete medium for the indicated times and counted in Newbauer chambers (n = 3).
FIGURE 8.
FIGURE 8.
RIAM-silenced melanoma cells have increased susceptibility to apoptosis. A, melanoma transfectants were incubated for 24 h in the presence of the indicated concentrations of cisplatin, and cell survival was measured as indicated under “Experimental Procedures” (left panel) or cell extracts subjected to immunoblotting using antibodies to the indicated proteins (right panel). The PARP antibody recognizes both the intact and cleaved fragment (CF). B, cells were treated for 14 h with 3 μm H2O2, and cell survival was measured as above. C, mock and D11 cells were embedded in three-dimensional (3-D) type I collagen gels, stained with DAPI or with an antibody to cleaved caspase-3, and analyzed by confocal microscopy. D, cells were exposed for the indicated times to cisplatin (50 μm) and subsequently subjected to Western blotting for detection of phosphorylated (pp38) or total p38 MAPK.

Similar articles

Cited by

References

    1. Bos J. L. (2005) Curr. Opin. Cell Biol. 17, 123–128 - PubMed
    1. Raaijmakers J. H., Bos J. L. (2009) J. Biol. Chem. 284, 10995–10999 - PMC - PubMed
    1. Boettner B., Van Aelst L. (2009) Curr. Opin. Cell Biol. 21, 684–693 - PMC - PubMed
    1. Bos J. L., Rehmann H., Wittinghofer A. (2007) Cell 129, 865–877 - PubMed
    1. Lafuente E. M., van Puijenbroek A. A., Krause M., Carman C. V., Freeman G. J., Berezovskaya A., Constantine E., Springer T. A., Gertler F. B., Boussiotis V. A. (2004) Dev. Cell 7, 585–595 - PubMed

Publication types

MeSH terms