. 2011 May 13;286(19):16693-706.
doi: 10.1074/jbc.M111.230136. Epub 2011 Mar 25.

N-acetylaspartylglutamate synthetase II synthesizes N-acetylaspartylglutamylglutamate

Affiliations

N-acetylaspartylglutamate synthetase II synthesizes N-acetylaspartylglutamylglutamate

Julia Lodder-Gadaczek et al. J Biol Chem. .

Abstract

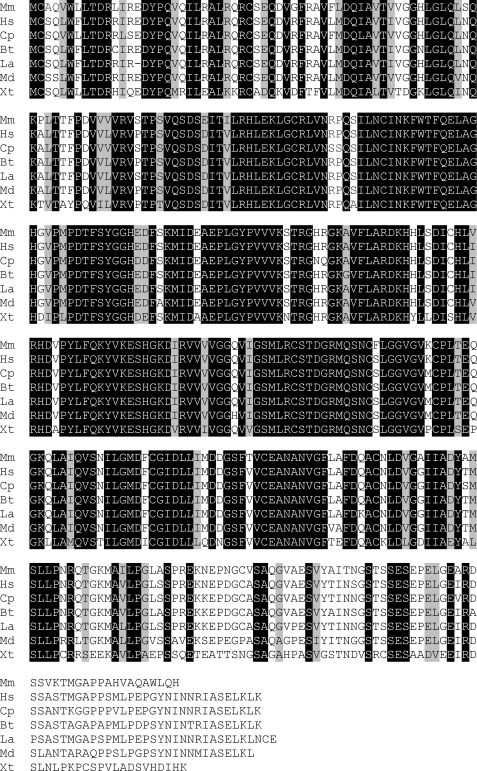
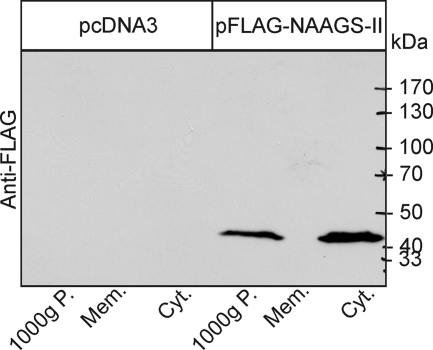
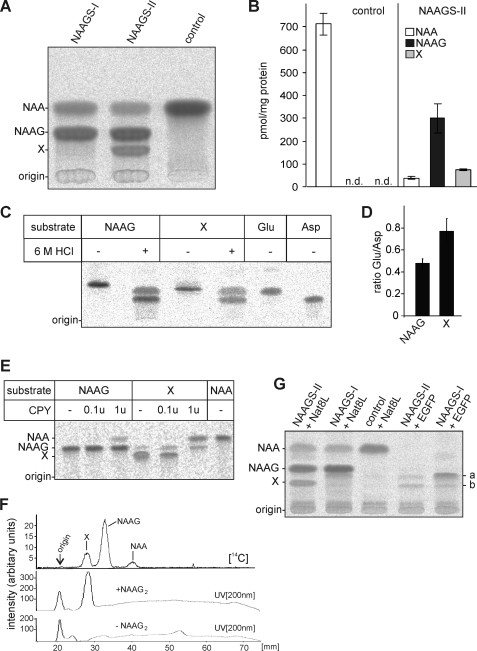
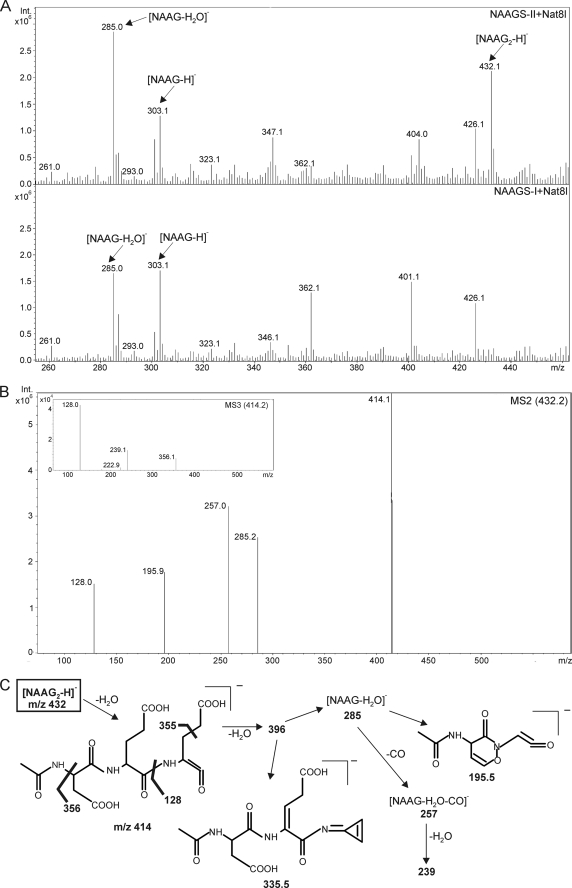
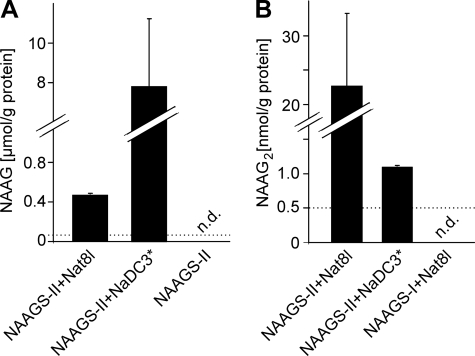
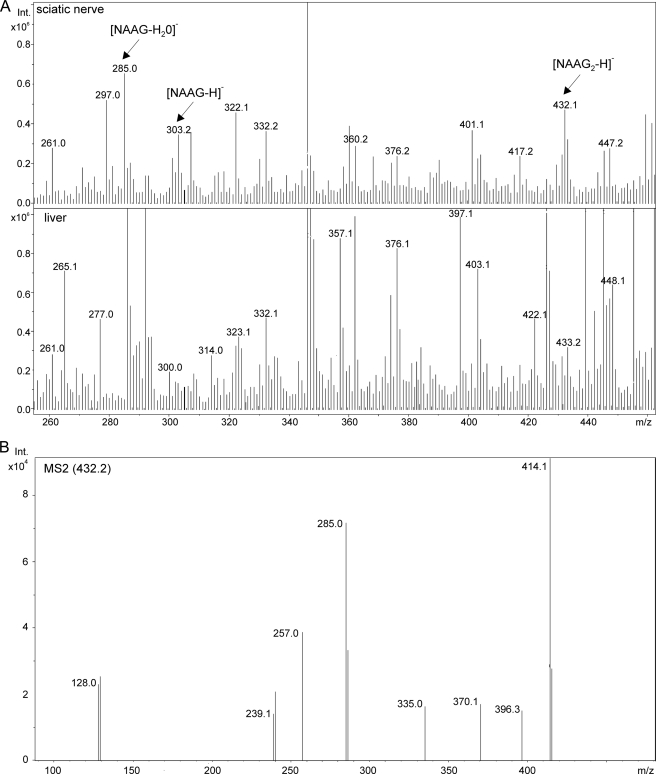
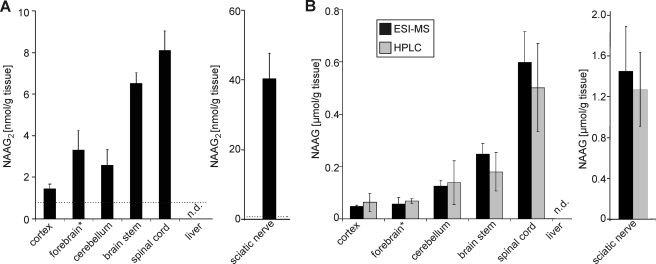
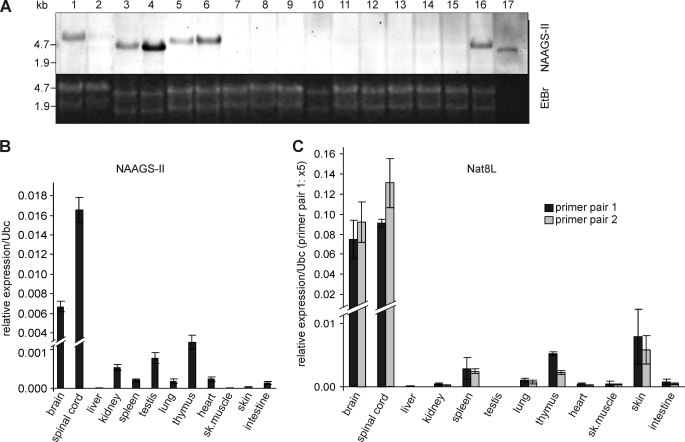
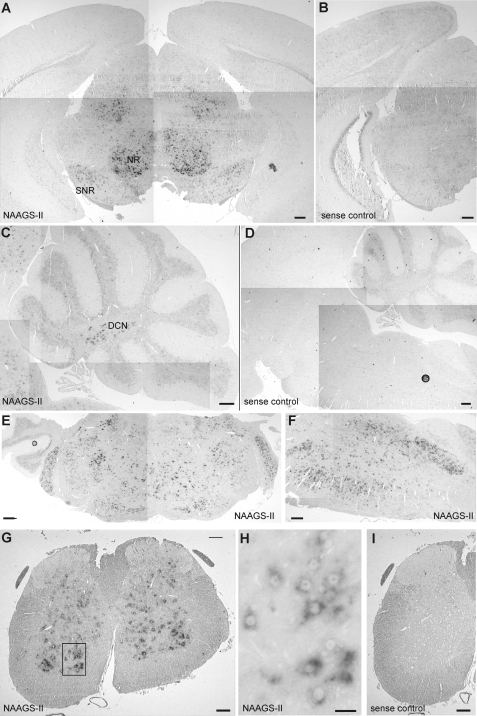
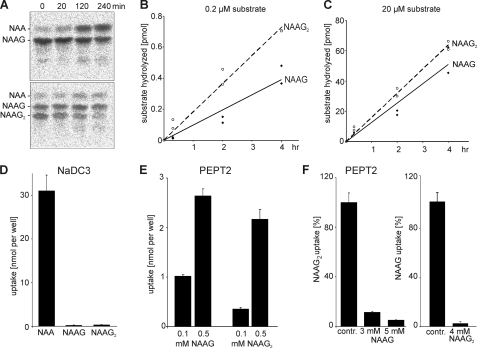
N-Acetylaspartylglutamate (NAAG) is found at high concentrations in the vertebrate nervous system. NAAG is an agonist at group II metabotropic glutamate receptors. In addition to its role as a neuropeptide, a number of functions have been proposed for NAAG, including a role as a non-excitotoxic transport form of glutamate and a molecular water pump. We recently identified a NAAG synthetase (now renamed NAAG synthetase I, NAAGS-I), encoded by the ribosomal modification protein rimK-like family member B (Rimklb) gene, as a member of the ATP-grasp protein family. We show here that a structurally related protein, encoded by the ribosomal modification protein rimK-like family member A (Rimkla) gene, is another NAAG synthetase (NAAGS-II), which in addition, synthesizes the N-acetylated tripeptide N-acetylaspartylglutamylglutamate (NAAG(2)). In contrast, NAAG(2) synthetase activity was undetectable in cells expressing NAAGS-I. Furthermore, we demonstrate by mass spectrometry the presence of NAAG(2) in murine brain tissue and sciatic nerves. The highest concentrations of both, NAAG(2) and NAAG, were found in sciatic nerves, spinal cord, and the brain stem, in accordance with the expression level of NAAGS-II. To our knowledge the presence of NAAG(2) in the vertebrate nervous system has not been described before. The physiological role of NAAG(2), e.g. whether it acts as a neurotransmitter, remains to be determined.


Figures

FIGURE 1.
FIGURE 1.
Sequence comparison of NAAGS-II from different vertebrate species. The amino acid sequences of NAAGS-II from mouse (Mm), human (Hs), guinea pig (Cp), cow (Bt), elephant (La), opossum (Md), and X. tropicalis (Xt) were aligned using CLUSTALW. Residues identical in all sequences are shaded black and residues that are similar in all sequences are shaded gray.
FIGURE 2.
FIGURE 2.
Western blot analysis. HEK-293T cells were transiently transfected with pFLAG-NAAGS-II or the empty vector pcDNA3. Cells were homogenized and fractionated by differential centrifugation. Equal fractions of the 1,000 × g pellet, 100,000 × g pellet (Mem.), and the 100,000 × g supernatant (Cyt.) were analyzed by Western blotting using anti-FLAG antibody.
FIGURE 3.
FIGURE 3.
Detection of NAAG synthesis by NAAGS-II. A, CHO-K1 cells transiently cotransfected with plasmids encoding the NAA transporter NaDC3 and NAAGS-I, NAAGS-II, or an irrelevant plasmid (control), were metabolically labeled with [14C]NAA for 16 h. Cells were homogenized in 90% methanol and, after cation exchange chromatography, analyzed by HPTLC. Positions of NAA and NAAG standards are indicated. In contrast to NAAGS-I expressing cells, NAAGS-II expression caused synthesis of an unknown product (X) in addition to the main pre-action product NAAG. B, the amount of NAA, and peptides NAAG and X synthesized in CHO-K1 cells expressing NAAGS-II together with NaDC3, and in control cells, metabolically labeled with [14C]NAA for 16 h were quantified using a Bioimager. Data shown are the mean ± S.D. (n = 3) of three experiments. N.D., not determined. C, HEK-293T cells coexpressing NAAGS-II and Nat8l were metabolically labeled with [14C]glutamate and NAAG and the unidentified products (X) were purified from a methanolic peptide extract by preparative TLC. NAAG and X were subjected to acid hydrolysis in 6 m HCl at 110 °C (+) and left untreated (−). Reaction products were separated by TLC together with 14C-labeled glutamate (Glu) and aspartate (Asp) standards. One representative experiment out of 4 independent experiments is shown. D, the ratio of [14C]Glu to [14C]Asp released by acid hydrolysis shown in C, demonstrated a significant higher Glu content in substance X compared with NAAG (mean ± S.D.; n = 4). E, NAAG and X were isolated as described in C, except that cells were labeled with [14C]NAA. Both substances were treated with increasing amounts of CPY and reaction products were separated by TLC. Although NAAG was a poor substrate for CPY, yielding only small amounts of NAA, peptide X was more efficiently digested by CPY, releasing NAA, and NAAG as an intermediate product (note that substance X could not be completely purified from contaminating NAAG by TLC; the NAAG signal, however, increased during incubation with CPY). F, peptide extracts from NaDC3 and NAAGS-II coexpressing CHO-K1 cells metabolically labeled with [14C]NAA (as shown in panel A) were separated by TLC, in the presence (+NAAG2) or absence (−NAAG2) of synthetic NAAG2, and the distribution of radioactivity was determined using a Bioimager. The position of the internal NAAG2 standard was detected by UV scan at 200 nm. 14C-Labeled substance X and synthetic NAAG2 comigrated. G, metabolic labeling of CHO-K1 cells expressing NAAGS-II or NAAGS-I (cotransfected with or without Nat8l expression plasmids or a control plasmid encoding the EGFP). These experiments showed that additional products (a and b) are synthesized by NAAGS-II and NAAGS-I in the presence and absence of NAA. These products were not detectable in cells transfected with a control and Nat8l expression plasmid.
FIGURE 4.
FIGURE 4.
ESI-MS detection of NAAG and NAAG2 in transfected cells. A, representative ESI-MS spectrum (negative ion mode) of peptide extracts from HEK-293T cotransfected with NAAGS-II and Nat8l (top) or NAAGS-I and Nat8l (bottom). B, fragmentation of the m/z = 432.1 mass peak obtained from peptide extracts of HEK-293T cells coexpressing NAAGS-II and Nat8l. The fragmentation pattern was in line with the NAAG2 structure, as shown in C, and comparable with the fragmentation pattern of synthetic NAAG2 (see supplemental Fig. S2).
FIGURE 5.
FIGURE 5.
Quantification of NAAG and NAAG2 synthesis in HEK-293T cells. HEK-293 cells were transfected with plasmids encoding NAAGS-II and Nat8l or NaDC3 (in NaDC3 expressing cells, 10 mm NAA was added to the culture medium). Methanol extracts were prepared and subjected to HPLC/ESI-MS analysis. A, NAAG was quantified by HPLC (detection at 214 nm). The detection limit for NAAG was 0.006 μmol/g of protein. B, NAAG2 was quantified by ESI-MS (mass peak of m/z = 432.1; see Fig. 4) using synthetic NAAG2 as external standard. The detection limit for NAAG2 was 0.5 nmol/g of protein. Data shown are the mean ± S.D. (n = 3) of three independent experiments. N.D., not determined.
FIGURE 6.
FIGURE 6.
ESI-MS detection of NAAG and NAAG2 in sciatic nerves. A, ESI-MS spectrum of peptide extracts of sciatic nerves and liver from wild-type mice. Mass peaks of m/z = 302.2 and 432.1, corresponding to NAAG and NAAG2, respectively, were detectable in sciatic nerves but not in the liver. B, the fragmentation pattern of the m/z = 432.1 mass peak obtained from sciatic nerve peptide extracts was in line with the NAAG2 structure (see fragmentation scheme in Fig. 4C), and comparable with the fragmentation pattern of synthetic NAAG2 (see supplemental Fig. S2).
FIGURE 7.
FIGURE 7.
Quantification of NAAG and NAAG2 in mouse tissues. Methanol extracts were prepared form the indicated brain regions/tissues. Note that the forebrain samples lacked part of the cortex of one hemisphere, as cortex samples were analyzed separately. NAAG2 (A) and NAAG (B) concentrations were determined by ESI-MS (black bars) (see Fig. 6). In addition, NAAG concentrations were determined by HPLC in the same extracts (gray bars). Both methods gave similar results. Neither NAAG nor NAAG2 were detectable in liver. The detection limit (indicated by a dotted line) for NAAG2 was 0.8 nmol/g of tissue (wet weight). The detection limit for NAAG was 9.4 (HPLC method) and 0.9 (ESI-MS method) nmol/g of tissue (wet weight). Shown are the mean ± S.D. (n = 4) of four independent experiments. N.D., not determined.
FIGURE 8.
FIGURE 8.
Expression of NAAGS-II in different mouse tissues. A, Northern blot analysis of NAAGS-II in different tissues of 10-week-old C57BL/6 mice using digoxigenin-labeled antisense cRNA probe, followed by chemiluminescence detection. RNA (20 μg/lane, except spinal cord, where only 5 μg was loaded) of the following tissues was analyzed: head of an embryo at E12.5 (1), body of embryo E12.5 without head (2), cerebellum (3), brain stem (4), forebrain (5), total brain (6), liver (7), spleen (8), kidney (9), adrenal gland (10), testis (11), lung (12), thymus (13), heart (14), skeletal muscle (15), eyes (16), and spinal cord (17). B, quantitative RT-PCR of NAAGS-II expression in various tissues of 10-week-old mice. Shown are the relative expressions after normalization to ubiquitin C (Ubc) as housekeeping control. C, quantitative RT-PCR of Nat8l expression in various tissues of 10-week-old mice. Two different primer pairs were used (see “Experimental Procedures”). Real time PCR data shown are the mean ± S.D. (n = 3) of three independent experiments (using RNA preparations from three different mice).
FIGURE 9.
FIGURE 9.
In situ hybridization of mouse brain sections. Paraffin-embedded sections of 10-week-old brains and spinal cord were hybridized to digoxigenin-labeled cRNA NAAGS-II antisense (NAAGS-II) or sense probes (sense control), as indicated. A and B, NAAGS-II expression was low in neocortex (Cx) and hippocampus (Hc), but prominent in different nuclei of the midbrain, e.g. red nucleus (NR) and substantia nigra (SNR). C and D, NAAGS-II expression was present in the deep nuclei of the cerebellum (DCN) but was hardly detectable in the cerebellar cortex. E and F, various nuclei in the pons and medulla showed high level expression of NAAGS-II. G–I, in the spinal cord, NAAGS-II expression was found in laminae III to X, with an apparently higher expression level in the ventral laminae. Only low to undetectable expression was observed in laminae I and II. H, a higher magnification of the ventral horn (boxed area in G) showed strong hybridization signals in large diameter cells, suggesting NAAGS-II expression in motor neurons. Scale bars, 200 (A–F), 100 (G and I), and 25 μm (H).
FIGURE 10.
FIGURE 10.
Hydrolysis of NAAG2 by GCP-II and PEPT2-dependent NAAG2 uptake. A, 14C-labeled NAAG and NAAG2 were isolated by preparative TLC from metabolically labeled HEK-293T cells and 0.2 μm 14C-labeled NAAG and NAAG2 were incubated with GCP-II for 0, 20, 120, and 240 min. Reaction products were separated by TLC. Note that [14C]NAAG2 used in these experiments was not completely separated from contaminating NAAG. B and C, quantification of the time dependence of NAAG and NAAG2 hydrolysis at two different concentrations (data from two independent experiments were combined). D, HEK-293T cells were transiently transfected with plasmids encoding NaDC3 and incubated with 0.5 mm 14C-labeled NAA, NAAG, or NAAG2 for 30 min at 37 °C in Locke's buffer (pH 7.4). After washing, radioactivity in cells was determined by liquid scintillation counting. E, HEK-293T cells were transiently transfected with plasmids encoding PEPT2 and incubated with 0.1 or 0.5 mm 14C-labeled NAAG or NAAG2 for 30 min at 37 °C in MES/Tris buffer (pH 6.0). F, NAAG inhibits NAAG2 uptake by PEPT2. PEPT2 expressing cells were incubated with 14C-labeled NAAG2 for 30 min at 37 °C in MES/Tris buffer (pH 6.0) in the absence (contr.) or presence of 3 or 5 mm unlabeled NAAG. Furthermore, NAAG2 inhibits NAAG uptake by PEPT2. PEPT2 expressing cells were incubated with 14C-labeled NAAG for 30 min at 37 °C in MES/Tris buffer (pH 6.0) in the absence (contr.) or presence of 4 mm unlabeled NAAG2. Note that the degree of purity of [14C]NAAG2 used for the NaDC3 and PEPT2 transport assays were much higher than that of [14C]NAAG2 used for the GCP-II assay shown in A. Examples of TLC analyses of peptide extracts from PEPT2 expressing HEK-293T cells after incubation with 14C-labeled NAAG2 are shown under supplemental Fig. S5.

Similar articles

Cited by

References

    1. Curatolo A., D'Arcangelo P., Lino A., Brancati A. (1965) J. Neurochem. 12, 339–342 - PubMed
    1. Coyle J. T. (1997) Neurobiol. Dis. 4, 231–238 - PubMed
    1. Neale J. H., Bzdega T., Wroblewska B. (2000) J. Neurochem. 75, 443–452 - PubMed
    1. Zaczek R., Koller K., Cotter R., Heller D., Coyle J. T. (1983) Proc. Natl. Acad. Sci. U.S.A. 80, 1116–1119 - PMC - PubMed
    1. Wroblewska B., Wroblewski J. T., Pshenichkin S., Surin A., Sullivan S. E., Neale J. H. (1997) J. Neurochem. 69, 174–181 - PubMed