. 2011 May 13;286(19):17103-11.
doi: 10.1074/jbc.M110.208082. Epub 2011 Mar 23.

Novel contact-dependent bone morphogenetic protein (BMP) signaling mediated by heparan sulfate proteoglycans

Affiliations

Novel contact-dependent bone morphogenetic protein (BMP) signaling mediated by heparan sulfate proteoglycans

Katsufumi Dejima et al. J Biol Chem. .

Abstract

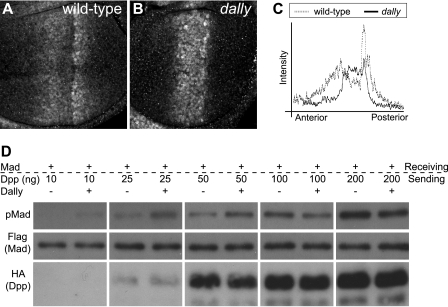
We previously proposed a model that DALLY, a Drosophila glypican, acts as a trans co-receptor to regulate BMP signaling in the germ line stem cell niche. To investigate the molecular mechanisms of contact-dependent BMP signaling, we developed novel in vitro assay systems to monitor trans signaling using Drosophila S2 cells. Using immunoblot-based as well as single-cell assay systems, we present evidence that Drosophila glypicans indeed enhance BMP signaling in trans in a contact-dependent manner in vitro. Our analysis showed that heparan sulfate modification is required for the trans co-receptor activity of DALLY. Two BMP-like molecules, Decapentaplegic (DPP) and Glass bottom boat, can mediate trans signaling through a heparan sulfate proteoglycan co-receptor in S2 cells. The in vitro systems reflect the molecular characteristics of heparan sulfate proteoglycan functions observed previously in vivo, such as ligand specificity and biphasic activity dependent on the ligand dosage. In addition, experiments using a DALLY-coated surface suggested that DALLY regulates DPP signaling in trans by its effect on the stability of DPP protein on the surface of the contacting cells. Our findings provide the molecular foundation for novel contact-dependent signaling, which defines the physical space of the stem cell niche in vivo.


Figures

FIGURE 1.
FIGURE 1.
DALLY in trans regulates DPP signaling in a contact-dependent manner. A, in vitro DPP signaling assay. S2 cells were transfected with Mad-FLAG cDNA with or without dally-myc cDNA. After 3 days, the cells were treated with undiluted (1×) or 1:10 diluted (0.1×) DPP-containing conditioned medium (supplemental Fig. S1). Control cells were treated with conditioned medium derived from a cell culture transfected with an empty vector. After the cells were incubated for 4 h at 22 °C, pMAD levels were analyzed by immunoblotting using anti-pMAD, anti-FLAG, and anti-Myc antibodies. B, DALLY in trans enhances DPP signaling in vitro. The DPP signaling activity in the receiving cells was assayed by immunoblotting using anti-pMAD antibody. The levels of MAD and DALLY were examined by anti-FLAG and anti-Myc antibodies, respectively. MAD phosphorylation was observed when the receiving cells were co-cultured with the dpp-expressing sending cells, and DPP signaling was enhanced in the presence of DALLY-Myc. C, the spGFP system in S2 cells is shown. spGFP constructs (spGFP1-10 and spGFP11), which encode two complementary portions of GFP, were expressed on the cell surface of each cell. When two cells make contact, spGFP fragments form a complex and reconstitute green fluorescence at the interface of the two cells (green). Nuclei were stained with TOPRO-3 (blue). D, the single-cell BMP-HSPG trans signaling assay is shown. The receiving cells (R) expressing Mad-FLAG and spGFP11 were co-cultured with the sending cells (S) expressing spGFP1-10 and indicated genes. DPP signaling in the receiving cells was assayed using anti-pMAD and anti-FLAG antibodies. Signals for anti-pMAD, anti-FLAG, and spGFP are shown in red, blue, and green, respectively. E, a quantification of pMAD-positive cells is shown. Bar graphs show the percentage of the receiving cells with strong (dark gray) and weak (light gray) pMad signals in the presence (GFP+) or absence (GFP−) of contact with the sending cells. The signal intensity of pMAD was determined as described under “Experimental Procedures.” Only cells with unsaturated anti-FLAG signals were scored. The number of cells scored is indicated below each bar graph (n). Error bars indicate standard error. p values were as follows: *, p < 0.05; **, p < 0.001; N.S., not significant (p > 0.05).
FIGURE 2.
FIGURE 2.
HS modification is required for DALLY-mediated pMAD activation in trans. A and B, S2 cells treated with ttv RNAi were analyzed by the immunoblot-based trans signaling assay. The receiving cells expressing Mad-FLAG were co-cultured with the sending cells expressing dpp (A) or both DPP and DALLY (B). Immediately after DNA transfection, dsRNA for ttv was introduced into the sending cells. The image of immunoblotting with anti-pMAD antibody shown in A was taken by a longer exposure than that of B to visualize the effect of DPP without DALLY co-transfection. C and D, effects of ttv RNAi were assayed by single-cell BMP-HSPG trans signaling assay. C, signals for anti-pMAD and anti-FLAG antibodies and spGFP are shown in red, blue, and green, respectively. D, quantification of pMAD-positive cells in the experiment shown in C. Quantification was performed as described in Fig. 1E. RNAi knockdown of ttv blocked DALLY-dependent phosphorylation of MAD protein. R, receiving cells; S, sending cells; *, p < 0.05.
FIGURE 3.
FIGURE 3.
Differential activity of DALLY and DLP in BMP trans signaling. Trans signaling was assayed using different combinations of the two ligands (DPP and GBB) and the two glypicans (DALLY and DLP), by the immunoblot-based trans signaling assay (A) and single cell assay (B and C). Quantification for the single cell assay using DPP and GBB are shown in B and C, respectively. p values are represented as in Fig. 1E. D, anti-pMAD staining of wing discs overexpressing dally and dlp in the dorsal compartment by ap-Gal4. D and V indicate the dorsal (dashed line) and ventral compartments, respectively. Expression of dally but not dlp expands the DPP activity gradient (arrows).
FIGURE 4.
FIGURE 4.
Biphasic activity of DALLY in DPP signaling. A–C, anti-pMAD staining of wild-type (A) and dally mutant (B) wing discs. Intensity plots of pMAD signals along the anterior-posterior axis in A (wild-type; dotted line) and B (dally; solid line) are shown in C. D, effects of DALLY on DPP signaling under different ligand concentrations. The sending cells were transfected with the indicated amount of dpp cDNA (ng) with or without dally. After co-culture with the receiving cells expressing Mad-FLAG, levels of pMAD and MAD-FLAG were analyzed by immunoblotting using anti-pMAD and anti-FLAG antibodies, respectively. DPP-HA in the conditioned medium was measured using anti-HA antibody.
FIGURE 5.
FIGURE 5.
DPP trans signaling on the DALLY-coated surface. A and B, DALLY immobilized on a glass slide enhances DPP- and GBB-dependent MAD phosphorylation. Mad-FLAG-transfected cells were seeded onto a glass slide coated with BSA or DALLY in the presence of DPP or GBB. After incubation, the cells were stained with anti-FLAG (blue) and anti-pMAD (red) antibodies (A). Shown is a quantification of the pMAD levels shown in A (B). Fluorescence intensity of anti-pMAD staining was calculated using ImageJ software and was normalized by that of anti-FLAG staining. The value of the control cells (Mock, BSA) was defined as 1 arbitrary unit (AU). C, time course of pMAD levels in the cells seeded on the DALLY-coated surface. S2 cells expressing Mad-FLAG were treated with DPP-containing conditioned medium. After washing, the cells were cultured on a BSA- or DALLY-coated slide. At indicated time points, pMAD and MAD-FLAG were detected by immunoblotting. D and E, DPP stability assay using a DALLY-coated surface. S2 cells were incubated with conditioned medium (CM) containing DPP-HA for 30 min. After unbound DPP was washed off, the cells were cultured for 6 h on a chamber slide coated with BSA or DALLY. Levels of DPP-HA protein were analyzed by immunoblotting using anti-HA antibody. DPP-HA levels shown in C were quantified using the Gel Analyzing function of ImageJ software (E).

References

    1. Jackson S. M., Nakato H., Sugiura M., Jannuzi A., Oakes R., Kaluza V., Golden C., Selleck S. B. (1997) Development 124, 4113–4120 - PubMed
    1. Fujise M., Takeo S., Kamimura K., Matsuo T., Aigaki T., Izumi S., Nakato H. (2003) Development 130, 1515–1522 - PubMed
    1. Belenkaya T. Y., Han C., Yan D., Opoka R. J., Khodoun M., Liu H., Lin X. (2004) Cell 119, 231–244 - PubMed
    1. Kirkpatrick C. A., Selleck S. B. (2007) J. Cell Sci. 120, 1829–1832 - PubMed
    1. Yayon A., Klagsbrun M., Esko J. D., Leder P., Ornitz D. M. (1991) Cell 64, 841–848 - PubMed

Publication types

LinkOut - more resources