. 2011 May 20;286(20):17467-77.
doi: 10.1074/jbc.M110.215434. Epub 2011 Mar 23.

Monoglyceride lipase deficiency in mice impairs lipolysis and attenuates diet-induced insulin resistance

Affiliations

Monoglyceride lipase deficiency in mice impairs lipolysis and attenuates diet-induced insulin resistance

Ulrike Taschler et al. J Biol Chem. .

Abstract

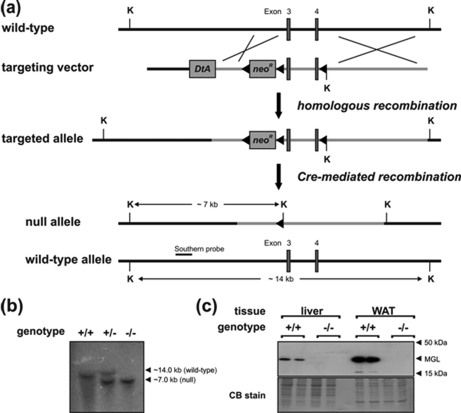
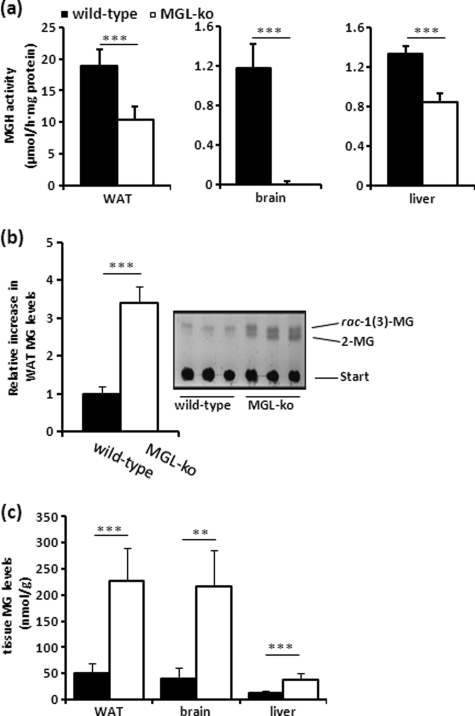
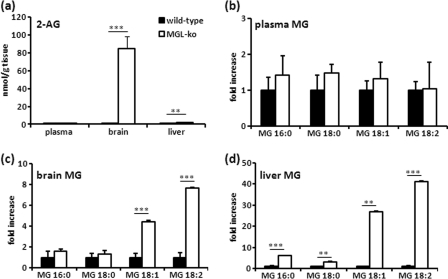
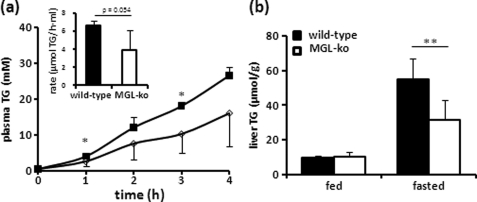
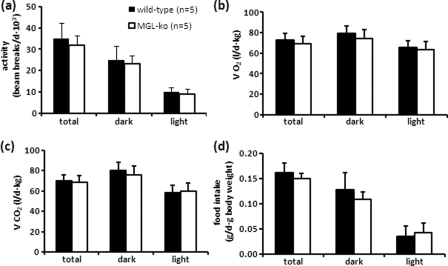
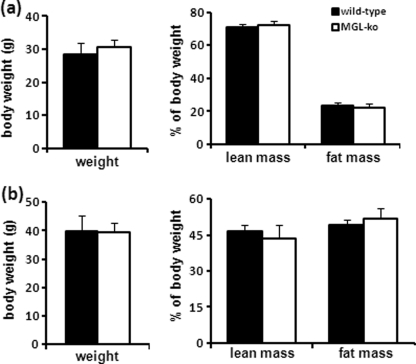
Monoglyceride lipase (MGL) influences energy metabolism by at least two mechanisms. First, it hydrolyzes monoacylglycerols (MG) into fatty acids and glycerol. These products can be used for energy production or synthetic reactions. Second, MGL degrades 2-arachidonoyl glycerol (2-AG), the most abundant endogenous ligand of cannabinoid receptors (CBR). Activation of CBR affects energy homeostasis by central orexigenic stimuli, by promoting lipid storage, and by reducing energy expenditure. To characterize the metabolic role of MGL in vivo, we generated an MGL-deficient mouse model (MGL-ko). These mice exhibit a reduction in MG hydrolase activity and a concomitant increase in MG levels in adipose tissue, brain, and liver. In adipose tissue, the lack of MGL activity is partially compensated by hormone-sensitive lipase. Nonetheless, fasted MGL-ko mice exhibit reduced plasma glycerol and triacylglycerol, as well as liver triacylglycerol levels indicative for impaired lipolysis. Despite a strong elevation of 2-AG levels, MGL-ko mice exhibit normal food intake, fat mass, and energy expenditure. Yet mice lacking MGL show a pharmacological tolerance to the CBR agonist CP 55,940 suggesting that the elevated 2-AG levels are functionally antagonized by desensitization of CBR. Interestingly, however, MGL-ko mice receiving a high fat diet exhibit significantly improved glucose tolerance and insulin sensitivity in comparison with wild-type controls despite equal weight gain. In conclusion, our observations implicate that MGL deficiency impairs lipolysis and attenuates diet-induced insulin resistance. Defective degradation of 2-AG does not provoke cannabinoid-like effects on feeding behavior, lipid storage, and energy expenditure, which may be explained by desensitization of CBR.


Figures

FIGURE 1.
FIGURE 1.
Targeting strategy and generation of MGL-ko mice. a, homologous recombination of the targeting vector with the wild-type allele resulted in the introduction of a loxP site (◀) into intron 4 and a neomycin resistance gene cassette flanked by loxP sites into intron 2 of the MGL gene. Subsequent Cre-recombinase-mediated recombination among the distal loxP sites resulted in the deletion of exon 3 and 4 of the MGL gene. The targeted allele was identified by KpnI (K) restriction digest and hybridization with an external Southern probe (solid bar) revealing a 7.0-kb DNA fragment. b, genomic DNA from mice was digested with KpnI and analyzed by Southern blotting using an external probe specific for intron 2 of the MGL gene. Autoradiography signals obtained from DNA fragments of 14.0 and 7.0 kb corresponded to wild-type (+) and targeted MGL (−) alleles, respectively. c, Western blotting analysis of MGL protein expression levels was performed with lysates of WAT and liver using a rabbit polyclonal MGL antiserum. The polyvinylidene fluoride membrane was stained with Coomassie Blue (CB) as loading control.
FIGURE 2.
FIGURE 2.
MGL-ko mice exhibit reduced MGH activity and accumulate MG in WAT, brain, and liver. a, MGH activities were determined in 20,000 × g infranatants of WAT, brain, and liver using rac-1(3)-oleoylglycerol (OG) as substrate. b, lipid extracts of WAT were separated by TLC and visualized by charring at 120 °C. Quantitation of TLC signals was performed using ImageQuant software. c, lipid extracts of WAT, brain, and liver were digested in a buffer containing purified recombinant mMGL exhibiting a specific activity of 4 mmol of MG/h··mg protein. The release of glycerol from lipid extracts was determined using a commercial kit (Sigma). Data are presented as mean ± S.D. (n = 5–6 for each genotype). **, p < 0.01; ***, p < 0.001.
FIGURE 3.
FIGURE 3.
MGL-ko mice accumulate 2-AG and other MG species in brain and liver. Tissue lipids were extracted with chloroform/methanol (1:1), and MG species were quantified by HPLC-MS using an internal standard (17:0 MG) and a standard curve for 2-AG. a, 2-AG concentrations in plasma, brain, and liver of wild-type and MGL-ko mice. b–d, relative changes in saturated and unsaturated MG species in plasma, brain, and liver. Data are presented as mean ± S.D. (n = 5 for each genotype). **, p < 0.01; ***, p < 0.001.
FIGURE 4.
FIGURE 4.
MGL and HSL are involved in MG degradation in WAT. a and b, basal and forskolin-stimulated release of FFA and glycerol from gonadal WAT. Fat pads (∼20 mg) were preincubated in Dulbecco's modified Eagle's medium, containing 2% defatted BSA in the absence or presence of 10 μm forskolin for 1 h at 37 °C. Thereafter, WAT pieces were transferred into identical fresh medium, and FFA and glycerol release were determined after incubation for another hour (n = 5 for each genotype). c, MGH activity in WAT was determined in 20,000 × g infranatants using various concentrations of rac-1(3)-OG as substrate. Experiments were performed in the absence or in the presence of the HSL inhibitor 76-0079 (n = 5 for each genotype). d, MGH activities were inhibited in 20,000 × g infranatants of WAT of wild-type mice using various concentrations of specific inhibitors for MGL (JZL 184), HSL (76-0079), or both inhibitors in combination (JZL184/76-0079). e, activity of HSL was determined in post-nuclear lysates (1000 × g supernatant) of COS-7 cells expressing murine HSL using 2-AG, rac-1(3)-OG, or 2-OG as substrate. The MGH activity detected in cells expressing β-galactosidase was set as blank. Data are presented as mean ± S.D. and are representative for at least three independent experiments. *, p < 0.05; **, p < 0.01; ***, p < 0.001.
FIGURE 5.
FIGURE 5.
Fasted MGL-ko mice exhibit reduced VLDL secretion and liver TG levels. a, VLDL secretion was determined in mice after a 16-h fasting period. To inhibit degradation of TG-rich lipoproteins, mice were treated with poloxamer 407 by intraperitoneal injection (1 mg/kg). TG secretion rate was calculated by linear regression from the increase in plasma TG over a period of 4 h (n = 4 for wild-type and n = 5 for MGL-ko mice, respectively). b, liver TG content of mice was determined in the fed state and after a 16-h fasting period (n = 6 for each genotype). Data are presented as mean ± S.D. *, p < 0.05; **, p < 0.01.
FIGURE 6.
FIGURE 6.
Locomotor activity, energy expenditure, and food consumption of MGL-ko mice are unchanged. Mice were housed in a laboratory animal monitoring system (LabMaster, TSE Systems), which allows the simultaneous measurement of locomotor activity (a), O2 consumption (VO2) (b), CO2 production (VCO2) (c), and food consumption (d). Mean values were calculated from a 72-h monitoring period of mice that have been familiarized with metabolic cages for at least 3 days (n = 5 for each genotype). Data are presented as mean ± S.D.
FIGURE 7.
FIGURE 7.
MGL-ko mice are more tolerant to the hypometabolic effect of the CBR agonist CP 55,940. Mice were fasted for 12 h and then treated with carrier solution alone (control, a–c), with 0.05 mg/kg (d–f), and with 0.15 mg/kg (g–i) of CP 55,940 (solubilized in PBS containing 5% ethanol and 5% Emulphor®) by intraperitoneal injection. Subsequently, locomotor activity (a, d, and g), O2 consumption (b, e, and h), and food intake (c, f, and i) were monitored for 2 h. Data are presented as mean ± S.D. (n = 6 for each genotype). *, comparison of wild-type and MGL-ko mice; #, comparison of agonist- and carrier-treated mice; *, #, p < 0.05; **, ##, p < 0.01; ***, p < 0.001.
FIGURE 8.
FIGURE 8.
MGL-ko exhibit normal weight, lean, and fat mass. Lean and fat mass of mice were analyzed by NMR (the minispec, NMR Analyzer, Bruker, Ettlingen, Germany). a, weight, lean, and fat mass of male mice on a normal chow diet at the age of 3 months (n = 6 per genotype); b, male mice at the age of 18 weeks fed a high fat diet or for 12 weeks (n = 10 and 11 for wild-type and MGL-ko mice, respectively). Data are presented as mean ± S.D.
FIGURE 9.
FIGURE 9.
MGL-ko mice receiving a high fat diet exhibit improved insulin sensitivity and glucose tolerance. For insulin and glucose tolerance tests (ITT and GTT), male mice were fasted for 4 and 6 h, respectively. Mice received an intraperitoneal injection of 0.75 IU of insulin or 1.5 mg of glucose per kg of body weight. Insets show the area under the curve (AUC). a, ITT and GTT were performed with male mice at the age of 12 weeks receiving a normal chow diet (n = 6 per genotype). b, ITT and GTT were performed with mice set on a high fat diet for 12 weeks (n = 10 for each genotype). Data are presented as mean ± S.D. *, p < 0.05; **, p < 0.01.

References

    1. Lowe M. E. (1997) Annu. Rev. Nutr. 17, 141–158 - PubMed
    1. Goldberg I. J., Merkel M. (2001) Front. Biosci. 6, D388–405 - PubMed
    1. Yen C. L., Cheong M. L., Grueter C., Zhou P., Moriwaki J., Wong J. S., Hubbard B., Marmor S., Farese R. V., Jr. (2009) Nat. Med. 15, 442–446 - PMC - PubMed
    1. Gao Y., Vasilyev D. V., Goncalves M. B., Howell F. V., Hobbs C., Reisenberg M., Shen R., Zhang M. Y., Strassle B. W., Lu P., Mark L., Piesla M. J., Deng K., Kouranova E. V., Ring R. H., Whiteside G. T., Bates B., Walsh F. S., Williams G., Pangalos M. N., Samad T. A., Doherty P. (2010) J. Neurosci. 30, 2017–2024 - PMC - PubMed
    1. Zimmermann R., Strauss J. G., Haemmerle G., Schoiswohl G., Birner-Gruenberger R., Riederer M., Lass A., Neuberger G., Eisenhaber F., Hermetter A., Zechner R. (2004) Science 306, 1383–1386 - PubMed

Publication types

MeSH terms