. 2011 May 27;286(21):18756-65.
doi: 10.1074/jbc.M110.206193. Epub 2011 Mar 30.

Structural analysis of the mechanism of inhibition and allosteric activation of the kinase domain of HER2 protein

Affiliations

Structural analysis of the mechanism of inhibition and allosteric activation of the kinase domain of HER2 protein

Kathleen Aertgeerts et al. J Biol Chem. .

Abstract

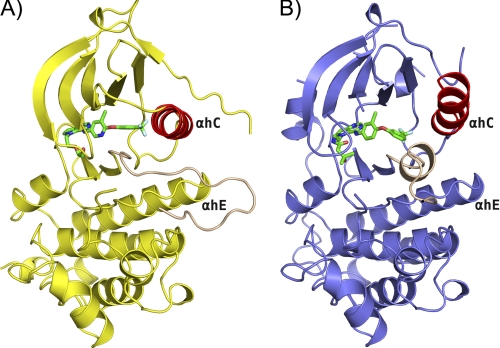
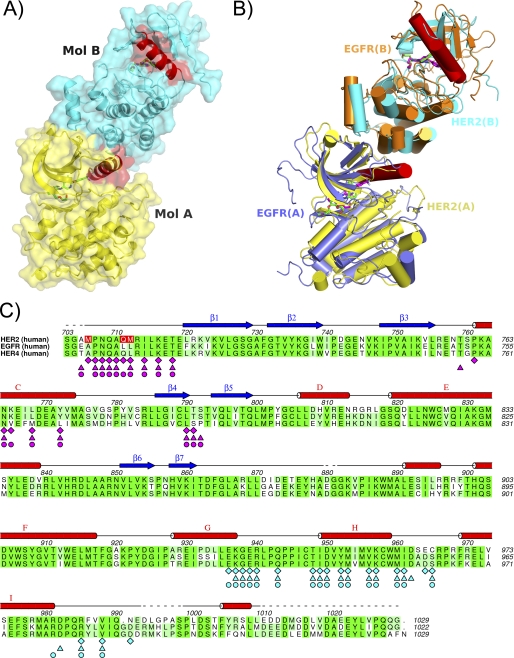
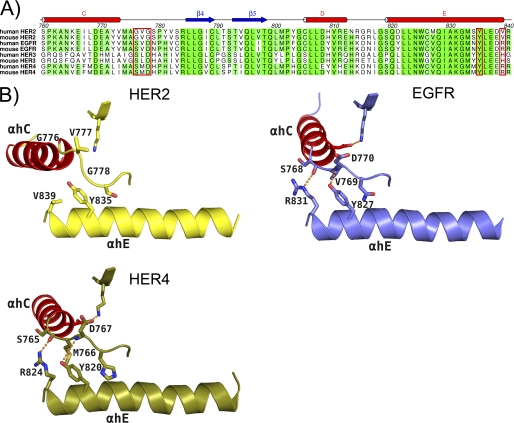
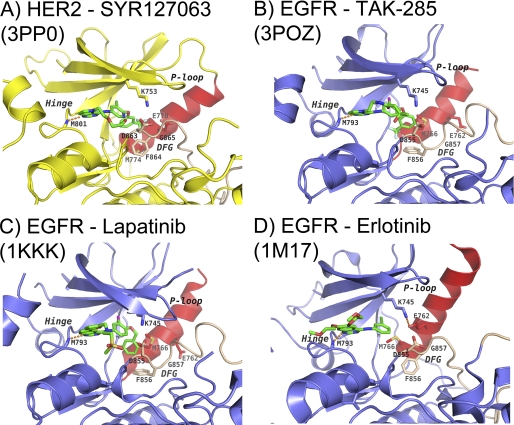
Aberrant signaling of ErbB family members human epidermal growth factor 2 (HER2) and epidermal growth factor receptor (EGFR) is implicated in many human cancers, and HER2 expression is predictive of human disease recurrence and prognosis. Small molecule kinase inhibitors of EGFR and of both HER2 and EGFR have received approval for the treatment of cancer. We present the first high resolution crystal structure of the kinase domain of HER2 in complex with a selective inhibitor to understand protein activation, inhibition, and function at the molecular level. HER2 kinase domain crystallizes as a dimer and suggests evidence for an allosteric mechanism of activation comparable with previously reported activation mechanisms for EGFR and HER4. A unique Gly-rich region in HER2 following the α-helix C is responsible for increased conformational flexibility within the active site and could explain the low intrinsic catalytic activity previously reported for HER2. In addition, we solved the crystal structure of the kinase domain of EGFR in complex with a HER2/EGFR dual inhibitor (TAK-285). Comparison with previously reported inactive and active EGFR kinase domain structures gave insight into the mechanism of HER2 and EGFR inhibition and may help guide the design and development of new cancer drugs with improved potency and selectivity.


Figures

FIGURE 1.
FIGURE 1.
Overall structure of HER2·SYR127063 and EGFR·TAK-285. Comparison of the overall structure of HER2 inhibited by SYR127063 (A) and of EGFR inhibited by TAK-285 (B). For HER2·SYR127063, the kinase domain is represented as a yellow schematic. For EGFR·TAK-285, the kinase domain is represented as a slate blue schematic. For both structures, α-helix C and the A-loop are colored red and tan, respectively. SYR127063 and TAK-285 are shown in a green stick representation colored by atom type. HER2 represents the active-like form of the kinase with the A-loop in an extended conformation. EGFR represents the inactive form of the kinase with a short α-helix present in the N-portion of the A-loop that stabilizes the active-site outward conformation of the α-helix C. αh, α-helix.
FIGURE 2.
FIGURE 2.
HER2 allosteric activating dimer. A, the HER2 dimer present in the asymmetric unit of the crystal is shown as a surface representation to depict the tight packing of the two monomers: Molecule (Mol.) A has a yellow surface, Molecule B has a cyan surface, and α-helix C is colored red in both molecules. The α-helix in Molecule A makes a close interaction with hydrophobic residues in the C-lobe of Molecule B. As a result of this interaction, the active conformation of the kinase is induced. B, superposition of HER2/SYR127063 dimer with EGFR/erlotinib dimer (Protein Data Bank code 1M17). The HER2/SYR127063 dimer is shown in yellow and cyan with SYR127063 as a magenta stick representation. The EGFR/erlotinib dimer is shown in slate blue and orange with erlotinib as a green stick representation. α-Helix C is shown in red for all molecules. C, sequence alignment between the kinase domains of HER2, EGFR, and HER4. Identical residues are highlighted in green boxes. Residues involved in close interactions at the dimer interface in HER2, EGFR, and HER4 derived from crystal structure information (Protein Data Bank codes 1M17 and 3BCE) are denoted by diamonds, stars, triangles, and circles, respectively, and are colored magenta for Molecule A and blue for Molecule B of the dimer. Mutations made in the HER2 construct are shown as red boxes. Secondary structure elements are assigned from the HER2·SYR127063 structure.
FIGURE 3.
FIGURE 3.
Origins of α-helix C conformational flexibility in HER2. A, sequence alignment of the amino acids in the region between α-helix C and α-helix E of HER family members that contain a cytoplasmic tyrosine kinase region. A Gly-rich sequence unique to HER2 in a region immediately following the α-helix C was observed. Residues labeled in B are shown in the red boxes. B, the αC-β4-loop region plays an important role in the proper positioning of the α-helix C through interactions with α-helix E of the C-lobe of the respective kinase. HER2 is represented as a yellow schematic with important side chains rendered by atom type. EGFR (Protein Data Bank code 1M14) is represented as a slate blue schematic with important side chains rendered by atom type. HER4 (Protein Data Bank code 3BCE) is represented as an army green schematic with important side chains rendered by atom type. For all kinases, α-helix C is represented as a red schematic. In both EGFR and HER4, conserved interactions are observed, but in HER2, conserved interactions are not observed. The unique Gly-rich sequence in this region in HER2 imparts an increased flexibility of the α-helix C. αh, α-helix.
FIGURE 4.
FIGURE 4.
HER2 and EGFR mechanism of inhibition. Binding modes of SYR127063 in HER2 (A), TAK-285 in EGFR (B), lapatinib in EGFR (Protein Data Bank code 1XKK) (C), and erlotinib in EGFR (Protein Data Bank code 1M17) (D) are shown. The protein backbone in HER2 is represented as a yellow schematic, whereas in EGFR, it is represented as a slate blue schematic. The DFG motif and part of the activation loop are colored tan, and the α-helix C is colored red for all proteins. Key protein side chains are shown as sticks and colored according to atom type. Inhibitors SYR127063, TAK-285, lapatinib, and erlotinib are shown as green sticks and colored according to atom type. Hydrogen bonds are indicated as orange dashed lines. The α-helix C position and the A-loop conformation of the EGFR·TAK-285 complex remarkably resemble those of the EGFR·lapatinib complex. The binding mode of SYR127063 in HER2 differs from TAK-285 in EGFR through the different substituent appended to the pyrrolo[3,2-d]pyrimidine N5 atom and the conformation of the 3-trifluoromethylphenyl group. The A-loop conformation of the HER2·SYR127063 complex is similar to that of the active EGFR·erlotinib complex. P-loop, phosphate-binding loop.

References

    1. Yarden Y., Sliwkowski M. X. (2001) Nat. Rev. Mol. Cell Biol. 2, 127–137 - PubMed
    1. Schlessinger J. (2004) Science 306, 1506–1507 - PubMed
    1. Carter P., Presta L., Gorman C. M., Ridgway J. B., Henner D., Wong W. L., Rowland A. M., Kotts C., Carver M. E., Shepard H. M. (1992) Proc. Natl. Acad. Sci. U.S.A. 89, 4285–4289 - PMC - PubMed
    1. Slamon D. J., Godolphin W., Jones L. A., Holt J. A., Wong S. G., Keith D. E., Levin W. J., Stuart S. G., Udove J., Ullrich A., Press M. F. (1989) Science 244, 707–712 - PubMed
    1. Shi F., Telesco S. E., Liu Y., Radhakrishnan R., Lemmon M. A. (2010) Proc. Natl. Acad. Sci. U.S.A. 107, 7692–7697 - PMC - PubMed

Publication types

MeSH terms