. 2011 Jun 10;286(23):20812-22.
doi: 10.1074/jbc.M110.206904. Epub 2011 Mar 17.

Peptidyl-prolyl cis/trans isomerase NIMA-interacting 1 associates with insulin receptor substrate-1 and enhances insulin actions and adipogenesis

Affiliations

Peptidyl-prolyl cis/trans isomerase NIMA-interacting 1 associates with insulin receptor substrate-1 and enhances insulin actions and adipogenesis

Yusuke Nakatsu et al. J Biol Chem. .

Abstract

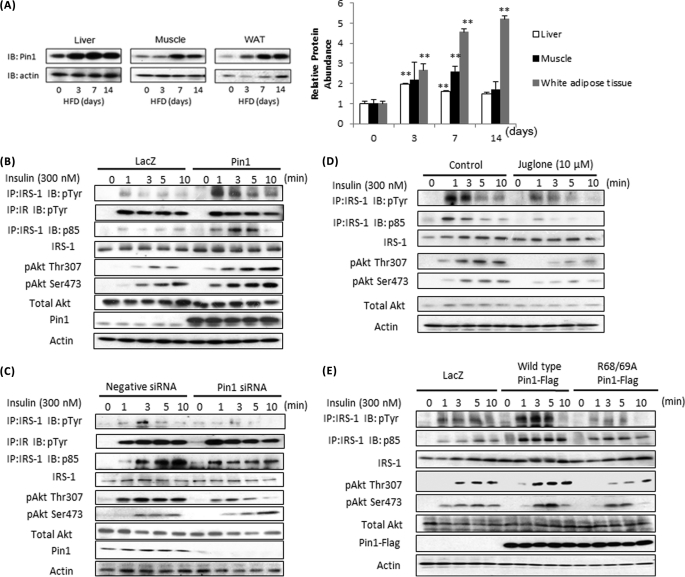
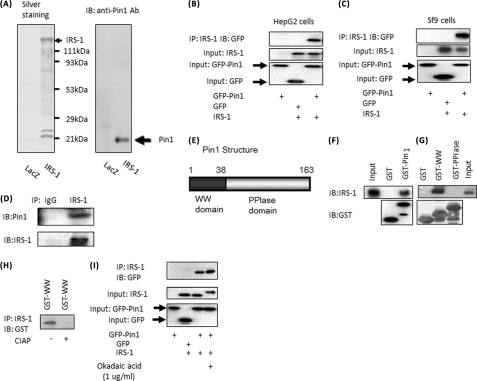
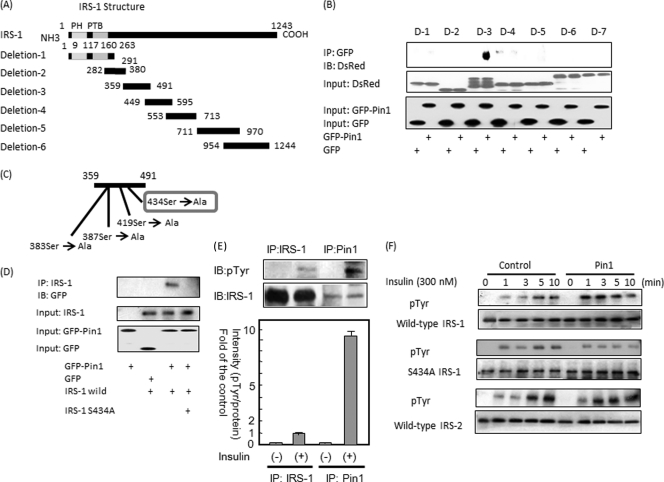
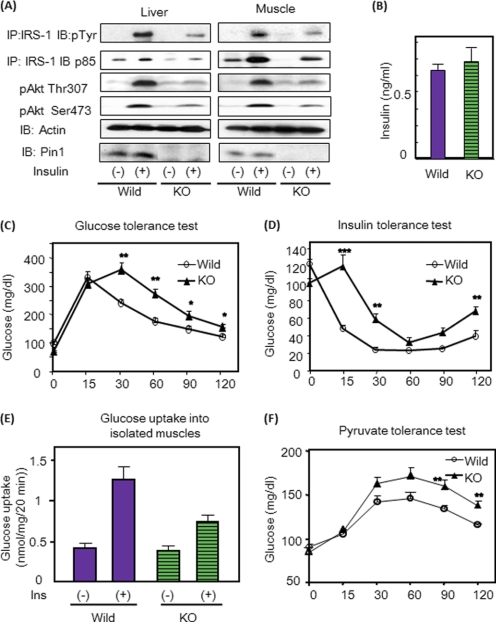
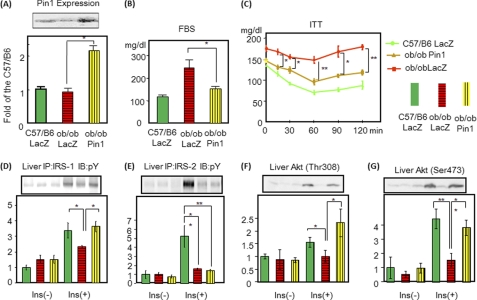
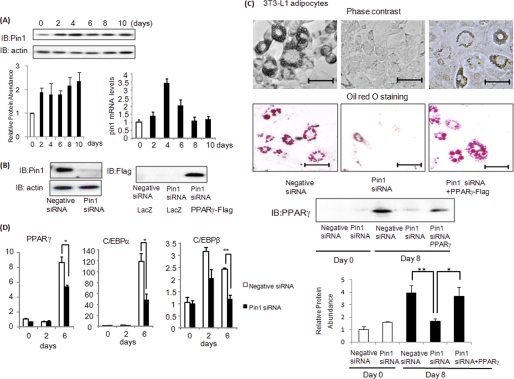
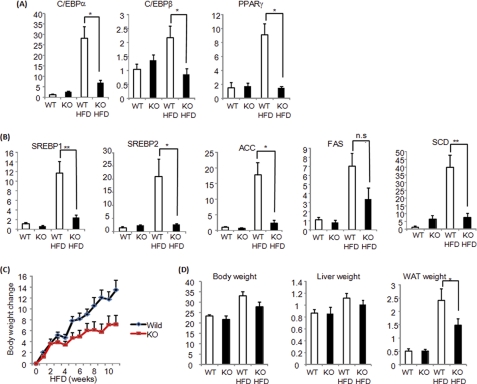
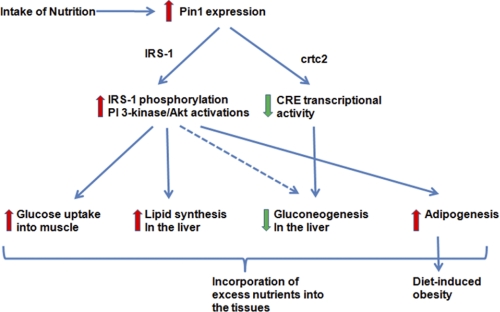
Peptidyl-prolyl cis/trans isomerase NIMA-interacting 1 (Pin1) is a unique enzyme that associates with the pSer/Thr-Pro motif and catalyzes cis-trans isomerization. We identified Pin1 in the immunoprecipitates of overexpressed IRS-1 with myc and FLAG tags in mouse livers and confirmed the association between IRS-1 and Pin1 by not only overexpression experiments but also endogenously in the mouse liver. The analysis using deletion- and point-mutated Pin1 and IRS-1 constructs revealed the WW domain located in the N terminus of Pin1 and Ser-434 in the SAIN (Shc and IRS-1 NPXY binding) domain of IRS-1 to be involved in their association. Subsequently, we investigated the role of Pin1 in IRS-1 mediation of insulin signaling. The overexpression of Pin1 in HepG2 cells markedly enhanced insulin-induced IRS-1 phosphorylation and its downstream events: phosphatidylinositol 3-kinase binding with IRS-1 and Akt phosphorylation. In contrast, the treatment of HepG2 cells with Pin1 siRNA or the Pin1 inhibitor Juglone suppressed these events. In good agreement with these in vitro data, Pin1 knock-out mice exhibited impaired insulin signaling with glucose intolerance, whereas adenoviral gene transfer of Pin1 into the ob/ob mouse liver mostly normalized insulin signaling and restored glucose tolerance. In addition, it was also demonstrated that Pin1 plays a critical role in adipose differentiation, making Pin1 knock-out mice resistant to diet-induced obesity. Importantly, Pin1 expression was shown to be up-regulated in accordance with nutrient conditions such as food intake or a high-fat diet. Taken together, these observations indicate that Pin1 binds to IRS-1 and thereby markedly enhances insulin action, essential for adipogenesis.


Figures

FIGURE 1.
FIGURE 1.
Pin1 enhances insulin signaling. A, mice were fed a control diet or HFD for the indicated periods. Liver, muscle, and adipose tissue lysates were prepared, then immunoblotted (IB) with anti-Pin1 or anti-actin antibody. B and C, Pin1 enhances insulin-induced IRS-1 phosphorylation and its downstream signaling. B, LacZ or Pin1 was overexpressed in HepG2 cells. IP, immunoprecipitates. C, HepG2 cells were treated with control siRNA or Pin1 siRNA. In both experiments, at the indicated times after initiating insulin stimulation, lysates were prepared from HepG2 cells. Then phosphorylation levels and protein amounts of IRS-1, p85 associated with IRS-1 and Akt Thr-307 and Ser-473 phosphorylations, and the Pin1 were determined. D, the Pin1 inhibitor Juglone attenuated the insulin-induced IRS-1 phosphorylation in HepG2 cells. HepG2 cells were treated with or without 10 μm Juglone for 30 min. At the indicated times after initiating insulin stimulation, lysates were prepared from HepG2 cells. Then phosphorylation levels and protein amounts of IRS-1, p85 associated with IRS-1, Akt Thr-307 and Ser-473 phosphorylations were determined. E, wild-type, but not the inactive mutant of Pin1, enhanced insulin-induced IRS-1 phosphorylation and its downstream signaling. LacZ, wild-type Pin1, or R68A/R69A-mutated Pin1 was overexpressed in HepG2 cells. At the indicated times after initiating insulin stimulation, lysates were prepared from HepG2 cells. Then, phosphorylation levels and protein amounts of IRS-1, p85 associated with IRS-1, and Akt Thr-307 and Ser-473 phosphorylations were determined. A representative immunoblot from four independent experiments is shown.
FIGURE 2.
FIGURE 2.
A, Pin1 association with IRS-1 is shown. IRS-1 with the N-terminal MEF tag was overexpressed in mouse liver using adenovirus gene transfer, and IRS-1-containing complexes were purified. The samples were electrophoresed, then silver-stained (left panel) and immunoblotted (IB) with anti-Pin1 antibody (Ab, right panel). B, IRS-1 or control LacZ was overexpressed with GFP or GFP-Pin1 in HepG2 cells. The cell lysates were immunoprecipitated (IP) with anti-IRS-1 antibody followed by immunoblotting with anti-GFP antibody. C, IRS-1 was overexpressed with GFP or GFP-Pin1 in Sf9 cells. The cell lysates were immunoprecipitated with anti-IRS-1 antibody followed by immunoblotting with anti-GFP antibody. D, the mouse liver cell lysates were immunoprecipitated with anti-IRS-1, and the immunoprecipitates were immunoblotted with anti-Pin1 and anti-IRS-1. E, Pin1 structure. GST-Pin1, GST-Pin1 WW domain, and GST-Pin1 PPIase domain were prepared. With incubation, these GST-proteins were conjugated to beads and cell lysates from IRS-1 overexpressing Sf-9 cells. F, GST-Pin1, but not GST alone, bound to IRS-1 in vitro. G, GST-WW, but not the GST-PPIase domain, bound IRS-1. H, lysates of Sf-9 cells overexprressing IRS-1 were treated with or without 40 units/ml alkaline phosphatase. Then the cell lysates were incubated with GST-WW domain and immunoprecipitated with anti-IRS-1 antibody. The immunoprecipitates were electrophoresed and immunoblotted with anti-GST antibody. I, HepG2 cells overexpressing IRS-1 or control LacZ were overexpressed with GFP or GFP-Pin1, then incubated with or without 1 μg/ml okadaic acid for 1 h. The cell lysates were immunoprecipitated with anti-IRS-1 antibody followed by immunoblotting with anti-GFP antibody.
FIGURE 3.
FIGURE 3.
A and B, the constructs of IRS-1 deletion mutants are shown. Baculoviruses expressing these six mutants with the N-terminal DsRed tag were prepared. These six deletion mutants were overexpressed with GFP or GFP-Pin1 in Sf-9 cells. The cell lysates were immunoprecipitated (IP) with anti-GFP antibody followed by immunoblotting (IB) with anti-DsRed antibody. The upper immunoblot shows that mutant 3 binds to GFP-Pin1, but not to GFP alone. PH, pleckstrin homology; PTB, phosphotyrosine binding. C and D, shown are the orientations of four candidate Ser/Pro motifs in mutant 3 involved in the association with Pin1. Wild-type IRS-1 or IRS-1 S434A was overexpressed with GFP-Pin1 or GFP in Sf-9 cells. The cell lysates were immunoprecipitated with anti-IRS-1 antibody followed by immunoblotting with anti-GFP. The upper panel shows that, unlike the wild type, IRS-1 S434A does not associate with Pin1. E, HepG2 cells were stimulated with insulin for 3 min, then cell lysates were immunoprecipitated with anti-IRS-1 or anti-Pin1 antibody. Both samples were electrophoresed and immunoblotted with anti-Tyr(P) (pTyr) or anti-IRS-1 antibody (upper panel). The IRS-1 phosphorylation level and protein amount were calculated as the means ± S.E. of three samples (*, p < 0.05). F, MEF-tagged IRS-1, MEF-tagged S434A IRS-1, and MEF-tagged IRS-2 were overexpressed with control LacZ or Pin1 in HepG2 cells. Cell lysates were then immunoprecipitated with anti-FLAG-tag antibody and immunoblotted with anti-Tyr(P) and anti-FLAG-tag antibodies.
FIGURE 4.
FIGURE 4.
Pin1 KO mice exhibit insulin resistance. A, insulin was injected into control and Pin1 KO mice, and IRS-1 and Akt phosphorylations were determined. IB, immunoblot. B, fasting insulin concentrations in control and Pin1 KO mice are shown. C, glucose tolerance test results are shown. 2 mg/kg glucose was injected into control and Pin1 KO mice, and blood glucose concentrations were measured as indicated. D, insulin tolerance test results are shown. 0.75 units/kg insulin was injected intraperitoneally into control, and Pin1 KO mice and blood glucose concentrations were measured as indicated. E, shown is glucose uptake into isolated muscle. F, pyruvate tolerance test results are shown. 2 mg/kg pyruvate was injected into control, and Pin1 KO mice and blood glucose concentrations were measured, as indicated. The results are presented as the means (±S.E.) of six independent experiments (*, p < 0.05; **, p < 0.01).
FIGURE 5.
FIGURE 5.
Hepatic overexpression of Pin1 normalizes the hyperglycemia with insulin resistance in ob/ob mice. LacZ or Pin1 adenovirus was injected via the tail vein. A, after 72 h, liver cell lysates were prepared, and the Pin1 expression level was determined by immunoblotting with anti-Pin1 antibody. The upper panel is a representative blot, and the lower graph shows the quantitative analysis (n = 6). B, shown are fasting blood glucose concentrations in C57/B6, ob/ob overexpressing LacZ, and ob/ob overexpressing Pin1 mice. C, insulin tolerance tests (ITT) for the three groups are shown. D and E, tyrosine phosphorylations of hepatic IRS-1 and IRS-2 are shown. Mice were injected with insulin via the portal vein, and phosphorylations of IRS-1 and IRS-2 were examined as reported previously. IP, immunoprecipitation; pY, Tyr(P). F and G, Akt phosphorylations at Thr-308 and Ser-473 were also examined in the livers of all three groups. n = 6 for each group and representative blots are shown in the upper panels. The results are presented as graphs with means (±S.E.). *, p < 0.05; **, p < 0.05.
FIGURE 6.
FIGURE 6.
Pin1 plays a critical role in adipose differentiation. A, 3T3-L1 preadipocytes were induced to differentiate into adipocytes, and Pin1 protein and mRNA levels were determined at the indicated periods after initiation of differentiation. IB, immunoblots. B, 3T3-L1 preadipocytes were treated with Pin1 siRNA. The amounts of Pin1 and actin protein were determined with immunoblotting. C, 3T3-L1 preadipocytes were treated with control or Pin1 siRNA,or in combination with Pin1 siRNA and FLAG-tagged PPARγ adenovirus gene transfer. These cells were then induced to differentiate into adipocytes. Microscopic observations and oil red O staining results at 8 days are shown. Expression of PPARγ protein was detected as a marker of adipocyte maturity. Scale bars = 50 μm. D, before and 2 or 6 days after the induction of differentiation, PPARγ, c/EBPα, and c/EBPβ mRNA levels of 3T3-L1 cells were determined by real-time PCR. *, p < 0.05; **, p < 0.05.
FIGURE 7.
FIGURE 7.
Pin1 KO mice are resistant to HFD-induced obesity. A, PPARγ, c/EBPα, and c/EBPβ mRNA levels in the adipose tissues of wild-type or Pin1 KO mice, fed a control diet or HFD for 4 weeks, were determined. B, SREBP1, SREBP2, ACC, FAS, and SCD mRNA levels in adipose tissues from wild-type or Pin1 KO mice, fed a control or HFD for 4 weeks, were determined by real-time PCR. C, weight gain after HFD feeding was compared between wild-type and Pin1 KO mice. D, the weights of the liver and adipose tissue were compared between wild-type and Pin1 KO mice, which had been fed either a control diet or HFD for 4 weeks. ACC, acetyl-CoA carboxylase; FAS, fatty acid synthase; SCD, stearoyl-CoA-desaturase.
FIGURE 8.
FIGURE 8.
Schema show the role of Pin1 in glucose and lipid metabolism in response to nutrient intakes.

References

    1. Fischer G., Wittmann-Liebold B., Lang K., Kiefhaber T., Schmid F. X. (1989) Nature 337, 476–478 - PubMed
    1. Liu J., Farmer J. D., Jr., Lane W. S., Friedman J., Weissman I., Schreiber S. L. (1991) Cell 66, 807–815 - PubMed
    1. Choi J., Chen J., Schreiber S. L., Clardy J. (1996) Science 273, 239–242 - PubMed
    1. Loewith R., Jacinto E., Wullschleger S., Lorberg A., Crespo J. L., Bonenfant D., Oppliger W., Jenoe P., Hall M. N. (2002) Mol. Cell 10, 457–468 - PubMed
    1. Schreiber S. L. (1991) Science 251, 283–287 - PubMed

MeSH terms