. 2011 May 20;286(20):18079-92.
doi: 10.1074/jbc.M111.236018. Epub 2011 Mar 30.

Trafficking kinesin protein (TRAK)-mediated transport of mitochondria in axons of hippocampal neurons

Affiliations

Trafficking kinesin protein (TRAK)-mediated transport of mitochondria in axons of hippocampal neurons

Kieran Brickley et al. J Biol Chem. .

Abstract

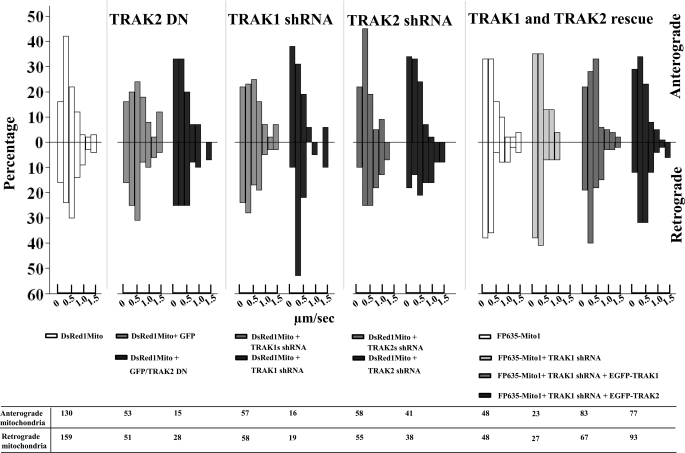
In neurons, the proper distribution of mitochondria is essential because of a requirement for high energy and calcium buffering during synaptic neurotransmission. The efficient, regulated transport of mitochondria along axons to synapses is therefore crucial for maintaining function. The trafficking kinesin protein (TRAK)/Milton family of proteins comprises kinesin adaptors that have been implicated in the neuronal trafficking of mitochondria via their association with the mitochondrial protein Miro and kinesin motors. In this study, we used gene silencing by targeted shRNAi and dominant negative approaches in conjunction with live imaging to investigate the contribution of endogenous TRAKs, TRAK1 and TRAK2, to the transport of mitochondria in axons of hippocampal pyramidal neurons. We report that both strategies resulted in impairing mitochondrial mobility in axonal processes. Differences were apparent in terms of the contribution of TRAK1 and TRAK2 to this transport because knockdown of TRAK1 but not TRAK2 impaired mitochondrial mobility, yet both TRAK1 and TRAK2 were shown to rescue transport impaired by TRAK1 gene knock-out. Thus, we demonstrate for the first time the pivotal contribution of the endogenous TRAK family of kinesin adaptors to the regulation of mitochondrial mobility.


Figures

FIGURE 1.
FIGURE 1.
Validation of TRAK2 DN: TRAK2 DN inhibits co-immunoprecipitation of full-length TRAK1 and TRAK2 with KIF5C and does not yield mitochondrial redistribution in KIF5C/TRAK2 DN-transfected cells. A, a schematic diagram of key domains of TRAK2. B, HEK 293 cells were transfected with either pIRES-GFP or pIRES-GFPTRAK2 DN, and cell homogenates were prepared and analyzed by immunoblotting using anti-TRAK2 or anti-GFP antibodies as shown. C, HEK 293 cells were co-transfected with pcDNAHisMaxKIF5C + pIRESTRAK2 DN, cell homogenates were prepared and solubilized, immunoprecipitations were carried out with anti-His or a non-immune control antibody, and pellets were analyzed by immunoblotting using antibodies as shown. D, HEK 293 cells were co-transfected with either pCMVTag4aTRAK2 + pIRESTRAK2 DN or pCMVTag4aTRAK2 + pCMVTag4aTRAK2(283–913), cell homogenates were prepared and solubilized, immunoprecipitations were carried out with anti-FLAG or a non-immune control antibody, and immune pellets were analyzed by immunoblotting using antibodies as shown. E, HEK 293 cells were co-transfected with pcDNAHisMaxKIF5C + pCIShTRAK1 + pIRES-GFP, pcDNAHisMaxKIF5C + pCIShTRAK1+ pIRES-GFPTRAK2 DN, pcDNAHisMaxKIF5C + pCISTRAK2 + pIRES-GFP, or pcDNAHisMaxKIF5C + pCISTRAK2+ pIRES-GFPTRAK2 DN; cell homogenates were prepared and solubilized; immunoprecipitations were carried out with an anti-His or a non-immune control antibody; and immune pellets were analyzed by immunoblotting using antibodies as shown. For C–E, all immunoblots have the same layout where lane 1 is detergent-solubilized HEK 293 cell homogenates, lane 2 is non-immune pellet, and lane 3 is immune pellet. Note that for double transfections 6% of immune pellets was analyzed for detection of immunoprecipitating (IP) antibody protein, whereas 94% of immune pellets was analyzed for detection of co-associating proteins. For triple transfections, 6% of immune pellets was analyzed for detection of immunoprecipitating antibody protein, whereas 47% of immune pellets was analyzed for detection of co-associating proteins. Immunoblots are representative of at least n = 3 separate immunoprecipitations from three independent transfections. → denotes KIF5C, TRAK1, TRAK2, TRAK2 DN, or hrGFP as appropriate. The positions of molecular mass standards (kDa) are on the right. F, COS-7 cells were transfected with pKIF5C-EYFP + pECFP-TRAK2 + pDsRed1-Mito or pKIF5C-EYFP + pECFP-TRAK2 + pIRESTRAK2 DN + pDsRed1-Mito. Cells were fixed 24–40 h post-transfection, stained with anti-TRAK2(8–633) antibodies and anti-rabbit Alexa Fluor 680 for detection of TRAK2 DN, and imaged by confocal microscopy. Outline refers to images with saturated fluorescence intensity to show complete cell outlines. The fluorophore is indicated on each image: yellow, KIF5C; blue, TRAK2 or TRAK2 DN; red, mitochondria. Merge shows respective merged images for each panel. Images are a single confocal section of a selected cell. Scale bars are 20 μm. Images are representative of at least n = 20 cells from at least n = 3 independent transfections. Note that the TRAK2/KIF5C/mitochondrial images are taken from Ref. and are shown for comparison.
FIGURE 2.
FIGURE 2.
TRAK2 DN decreases mitochondrial mobility in axons of hippocampal pyramidal neurons: demonstration by live imaging. Hippocampal neurons prepared from P0 rat brain were transfected at 4 DIV with either pDsRed1-Mito, pDsRed1-Mito + pIRES-GFP, pDsRed1-Mito + pIRES-GFPTRAK2 DN, or pDsRed1-Mito + pIRES-GFPTRAK2 DN and pEYFP-synaptophysin and imaged at 6 DIV all as described under “Experimental Procedures.” A is a representative example of a transfected neurone where Outline refers to an image with saturated fluorescence intensity to show the complete cell outline, GFP shows the green fluorescence enabling identification of the transfected neuron, DsRed1-Mito shows the distribution of mitochondria, and Merge shows a merge of GFP + DsRed1-Mito fluorescence. B is a representative series of time lapse images for each of the above transfection conditions taking a cropped area typical of that shown in A. C, kymographs of the time lapse images. The parameters of mitochondrial dynamics are summarized in Table 2.
FIGURE 3.
FIGURE 3.
Validation of TRAK1- and TRAK2-targeted shRNAis in heterologous expression. A and B demonstrate the specificity of the TRAK1 shRNAi probe, and C and D demonstrate the specificity of the TRAK2 shRNAi probe. In A and C, HEK 293 cells were co-transfected with TRAK1 or TRAK2 clones and either pGreenTRAK1 or pGreenTRAK1scr (A) or pGreenTRAK2 or pGreenTRAK2scr (C). Cell homogenates were collected 24 h post-transfection, and aliquots were analyzed in triplicate by immunoblotting using either anti-β-actin or anti-TRAK1(8–633) antibodies that recognize both TRAK1 and TRAK2 as indicated. The histograms show the percentage of knockdown of the exogenous TRAK. Values were normalized using actin expression. Values are presented as the percentage of knockdown with respect to shRNAi scrambled controls and are the means ± S.E. for n = 3 independent transfection experiments. The percentage of knockdown of TRAK1 by TRAK1 shRNAi was 97 ± 3%, and for knockdown of TRAK2 by TRAK2 shRNAi, the value was 96 ± 2%. TRAK1 shRNAi had no significant effect on TRAK2 expression and vice versa for TRAK2 shRNAi. In B and D, COS-7 cells were co-transfected with pDsRed1-Mito + pKIF5C-EYFP + pEGFP-rTRAK1 and either pGreenTRAK1 or pGreenTRAK1scr (B) or pGreenTRAK2 or pGreenTRAK2scr (D) as indicated in the left-hand squares. In B also, COS-7 cells were co-transfected with pDsRed1-Mito + pKIF5C-EYFP + pEGFP-rTRAK1silent (bottom panel) + pTRAK1. Cells were imaged by confocal microscopy 24 h post-transfection. Outline refers to images with saturated fluorescence intensity to show complete cell outlines. The fluorophore is indicated on each image: green, ZsGFP; red, mitochondria. Merge shows respective merged images for each panel. Images are a single confocal section of a selected cell. Scale bars are 20 μm. Images are representative of at least n = 20 cells from at least n = 3 independent transfections.
FIGURE 4.
FIGURE 4.
Knockdown of TRAK1 by targeted TRAK1 shRNAi reduces mitochondrial transport in axons of hippocampal neurons. Hippocampal neurons prepared from P0 rat brain were transfected at 3 DIV with either pDsRed1-Mito alone, pDsRed1-Mito + the scrambled shRNAi, pGreenTRAK1scr, or pDsRed1-Mito + pGreenTRAK1 or for the rescue experiments with pTurboFP635-NMito, pTurboFP635-NMito + pRedTRAK1, pTurboFP635-NMito + pRedTRAK1 + pEGFP-rTRAK1silent, or pTurboFP635-NMito + pRedTRAK1 + EGFPTRAK2 and imaged at 6 DIV all as described under “Experimental Procedures.” A and C are representative examples of transfected neurons where Outline refers to an image with saturated fluorescence intensity to show the complete cell outline. In A, ZsGFP shows the green fluorescence enabling identification of transfected neurons, DsRed1-Mito shows the distribution of mitochondria, and Merge shows the merge of ZsGFP + DsRed1-Mito fluorescence. In C, DsRedTRAK1 shows the red fluorescence (colored here blue) for the TRAK1 shRNAi vector, TurboP635-Mito shows the distribution of mitochondria, GFP-TRAK1silent shows the fluorescence due to EGFP-rTRAK1silent, and Merge shows a merge of all three. B and D show a section of an axon at time t = 0 for each condition as labeled with the respective kymographs below. Scale bars are 20 μm. The parameters of mitochondrial dynamics are summarized in Table 2.
FIGURE 5.
FIGURE 5.
Velocity profiles for mobile mitochondria in axons of hippocampal neurons: effect of TRAK1-induced arrest and TRAK1 and TRAK2 rescue of movement. The velocities of all mobile mitochondria in axons of hippocampal pyramidal neurons from experiments described in Tables 1–3 were determined as described under “Experimental Procedures.” Velocities were sorted into the following ranges: 0–0.2, 0.2–0.4, 0.4–0.6, 0.6–0.8, 0.8–1, 1.0–1.2, and >1.2 μm/s. The figure shows the percentage for each velocity range in both anterograde and retrograde directions for each condition together with the number of mobile mitochondria analyzed.

References

    1. Boldogh I. R., Pon L. A. (2007) Trends Cell Biol. 17, 502–510 - PubMed
    1. Detmer S. A., Chan D. C. (2007) Nat. Rev. Mol. Cell Biol. 8, 870–879 - PubMed
    1. MacAskill A. F., Kittler J. T. (2010) Trends Cell Biol. 20, 102–112 - PubMed
    1. Yi M., Weaver D., Hajnóczky G. (2004) J. Cell Biol. 167, 661–672 - PMC - PubMed
    1. Chang D. T., Honick A. S., Reynolds I. J. (2006) J. Neurosci. 26, 7035–7045 - PMC - PubMed

Publication types

LinkOut - more resources