. 2011 May 27;286(21):18383-96.
doi: 10.1074/jbc.M111.241182. Epub 2011 Mar 22.

Differences between human and rodent pancreatic islets: low pyruvate carboxylase, atp citrate lyase, and pyruvate carboxylation and high glucose-stimulated acetoacetate in human pancreatic islets

Affiliations

Differences between human and rodent pancreatic islets: low pyruvate carboxylase, atp citrate lyase, and pyruvate carboxylation and high glucose-stimulated acetoacetate in human pancreatic islets

Michael J MacDonald et al. J Biol Chem. .

Abstract

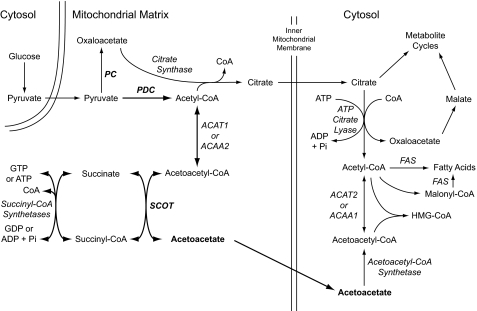
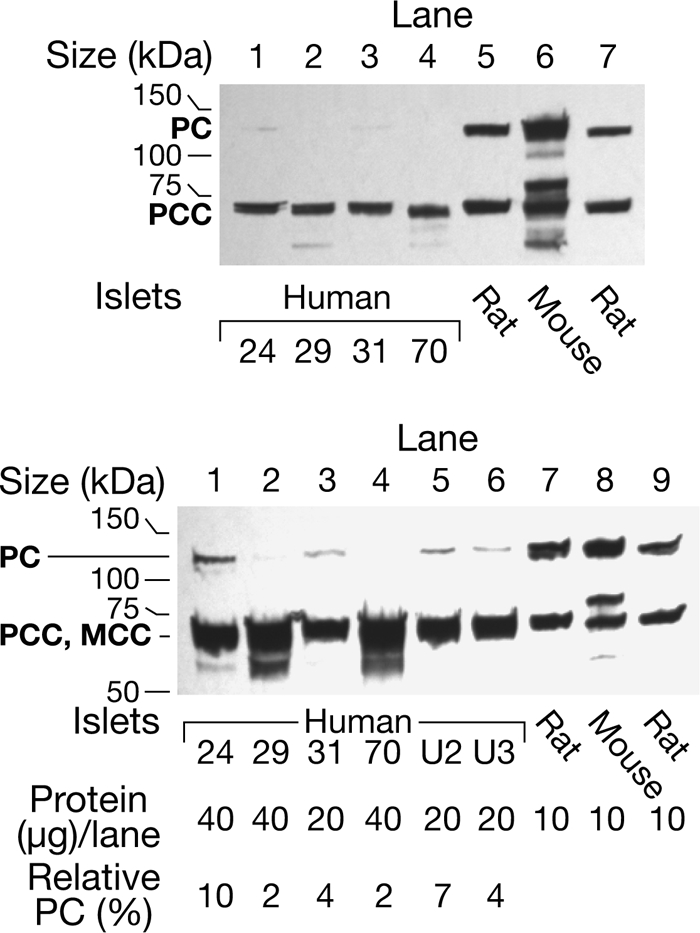
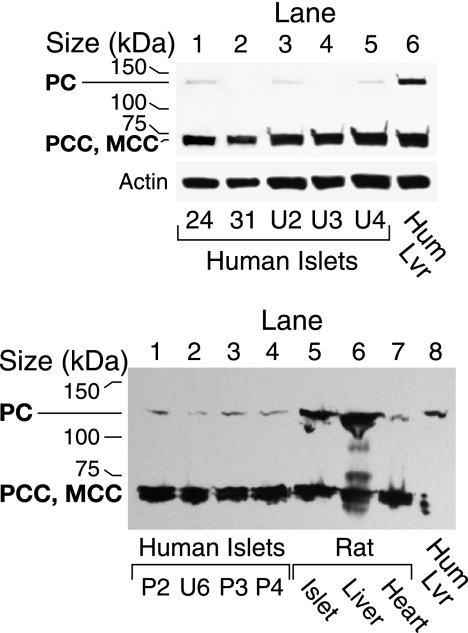
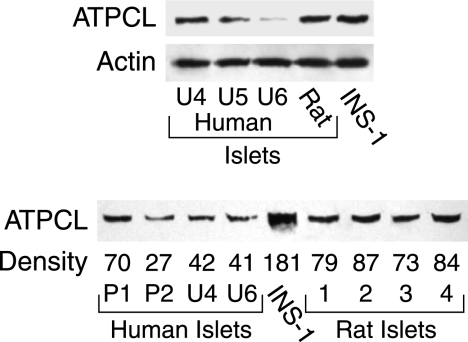
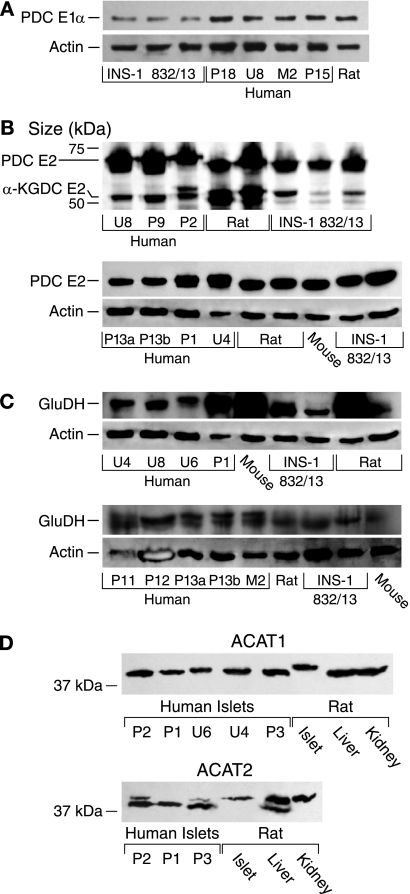
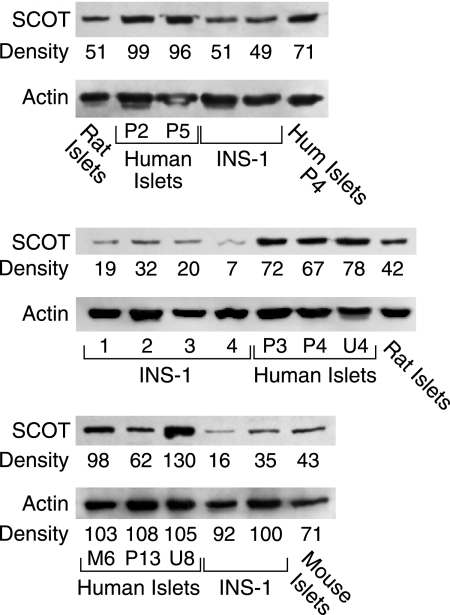
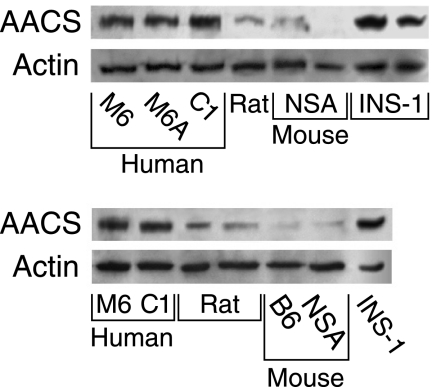
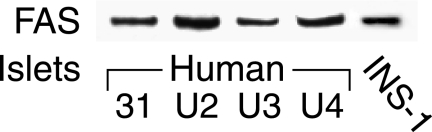
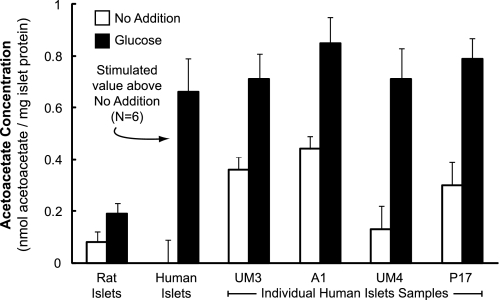
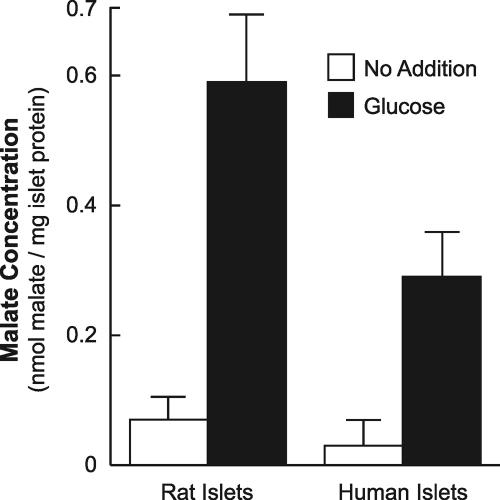
Anaplerosis, the net synthesis in mitochondria of citric acid cycle intermediates, and cataplerosis, their export to the cytosol, have been shown to be important for insulin secretion in rodent beta cells. However, human islets may be different. We observed that the enzyme activity, protein level, and relative mRNA level of the key anaplerotic enzyme pyruvate carboxylase (PC) were 80-90% lower in human pancreatic islets compared with islets of rats and mice and the rat insulinoma cell line INS-1 832/13. Activity and protein of ATP citrate lyase, which uses anaplerotic products in the cytosol, were 60-75% lower in human islets than in rodent islets or the cell line. In line with the lower PC, the percentage of glucose-derived pyruvate that entered mitochondrial metabolism via carboxylation in human islets was only 20-30% that in rat islets. This suggests human islets depend less on pyruvate carboxylation than rodent models that were used to establish the role of PC in insulin secretion. Human islets possessed high levels of succinyl-CoA:3-ketoacid-CoA transferase, an enzyme that forms acetoacetate in the mitochondria, and acetoacetyl-CoA synthetase, which uses acetoacetate to form acyl-CoAs in the cytosol. Glucose-stimulated human islets released insulin similarly to rat islets but formed much more acetoacetate. β-Hydroxybutyrate augmented insulin secretion in human islets. This information supports previous data that indicate beta cells can use a pathway involving succinyl-CoA:3-ketoacid-CoA transferase and acetoacetyl-CoA synthetase to synthesize and use acetoacetate and suggests human islets may use this pathway more than PC and citrate to form cytosolic acyl-CoAs.


Figures

FIGURE 1.
FIGURE 1.
Pathways of glucose-derived pyruvate via the pyruvate dehydrogenase complex and SCOT to produce acetoacetate and via pyruvate carboxylase and ATP citrate lyase to produce malate and citrate in mitochondria for export to the cytosol in the pancreatic beta cell. The SCOT pathway is shown with thicker arrows. Abbreviations used are as follows: ACAA1 or ACAA2, acetyl-CoA acyltransferase 1 or 2; ACAT1 or ACAT2, acetyl-CoA acetyltransferase 1 or 2; FAS, fatty-acid synthase.
FIGURE 2.
FIGURE 2.
Level of pyruvate carboxylase protein is much lower in human pancreatic islets than in mouse and rat islets. The upper panel shows a streptavidin-probed blot of islets from four human individuals identified by numbers and islets from the rat and the mouse. Each preparation was snap-frozen immediately after isolation. All of these samples happen to have been stored frozen as islet pellets for 8–10 years before they were homogenized in a solution of KMSH containing 1 mm dithiothreitol and analyzed. There was 15-μg whole-cell proteins per lane. The band that migrates at ∼130 kDa is PC and is not visible (lanes 2 and 4) or barely visible (lanes 1 and 3) in the islets from the humans. The band at ∼72 kDa is the α-chain of propionyl-CoA carboxylase (PCC) (with or without methylcrotonyl-CoA carboxylase (MCC) that migrates close to the α-chain of PCC). The density of this band is relatively the same in lanes of the human and rodent islets. The lower panel shows the semiquantification of PC protein and is a streptavidin-probed blot in which larger amounts (20 or 40 μg) of whole-cell protein were added to the lanes containing human islet samples than were added to the lanes containing rodent islet samples. Lanes 1–4 contained the human islets and lanes 7 and 8 contained the rat and mouse islets shown in the top panel. Lanes 5 and 6 contained human islet samples homogenized and boiled in SDS gel sample buffer on the day of receipt and analyzed 1 month and 1 week later, respectively; and lane 9 contained rat islets stored as a frozen homogenate 3 months before analysis. Densitometric quantification of the PC band indicated that the amount of PC protein/μg islet cell protein was 2–10% of the average of the amounts of PC in the three rodent lanes.
FIGURE 3.
FIGURE 3.
Low level of PC in human islets cannot be explained by exquisite instability of the human PC protein because the PC protein is stable in human liver. Upper panel, streptavidin-probed blot with 15 μg of cell protein/lane. Human liver (Hum Lvr) was stored frozen for 7 months before analysis. Human islets 24 and 31 were snap-frozen and stored 8–10 years, and islets U2 and U3 were cultured on 1 day and placed in gel loading buffer the same day and then analyzed at <4 weeks (U2) or <2 weeks (U3) or snap-frozen right after isolation and put in loading buffer the same day and analyzed 5 days later (U4). The density of the PCC/methylcrotonyl-CoA carboxylase (MCC) bands is relatively the same across the lanes. The membrane was stripped of streptavidin and reprobed with anti-β-actin antibody to show relatively equal loading of total cell protein across lanes. Lower panel, low PC protein in fresh cultured human pancreatic islets compared with rat islets, rat liver, or human liver. This panel shows a streptavidin-probed blot with 15 μg of whole-cell protein/lane, except for lane 8 where the protein equaled 4 μg. Human islet samples in lanes 1–4 were maintained in tissue culture medium for 2 or 24 h prior to homogenization. Rat heart is shown as a tissue in which the level of PC is low.
FIGURE 4.
FIGURE 4.
Lower level of ATP citrate lyase protein in human islets than in rat islets. Top panel, immunoblot with 15 μg of whole-cell protein in each lane. The actin bands show equal loading of protein across the lanes. Lower panel, immunoblot with 15 μg of whole-cell protein/lane in 1st to 6th lanes. 7th to 9th lanes (from left) had 12, 11, and 9 μg of protein/lane, respectively. The relative densities of each ATP citrate lyase (ATPCL) band are shown at the bottom of the band without correction for the lower amounts of protein in the 7th to 9th lanes that contained rat islet protein.
FIGURE 5.
FIGURE 5.
Levels of pyruvate dehydrogenase complex E1α and E2 proteins, α-ketoglutarate dehydrogenase complex E2 protein, glutamate dehydrogenase protein, and acetyl-CoA acetyltransferases 1 and 2 proteins in human islets are comparable with or higher in human islets than in rat islets or INS-1 832/13 cells. A, levels of PDC E1α protein in human and rat islets are higher than in INS-1832/13 cells. Immunoblot is shown with 15 μg of protein of whole-cell protein/lane probed with anti-PDC E1α antibody and stripped of antibody and reprobed with anti-β-actin antibody to show relative loading of protein across lanes. B, top panel, immunoblot with 20 μg of whole-cell protein/lane. It was probed with affinity-purified primary biliary cirrhosis (PBC) IgG at a 1:20,000 dilution that reacts against the PDC and α-ketoglutarate dehydrogenase complex (KDC) E2 proteins. Lower panel, immunoblot with 5 μg of whole-cell protein/lane probed with the primary biliary cirrhosis IgG at a dilution of 1:30,000 and reprobed with anti-β-actin antibody to indicate the relative total cell protein levels across the lanes. C, two immunoblots. Membranes were probed with anti-glutamate dehydrogenase (GluDH) antibody, stripped of antibody, and reprobed with anti-β-actin antibody to show relative loading of protein across lanes. Lanes in both panels contained 15 μg of whole-cell protein/lane except 3rd lane from left in the upper panel contained 13 μg of protein/lane. D, bottom panels, immunoblots with 15 μg of whole-cell protein/lane (ACAT1, mitochondrial acetyltransferase; ACAT2, cytosolic acetyltransferase).
FIGURE 6.
FIGURE 6.
Level of SCOT protein is higher in human islets than in rat islets and INS-1 832/13 cells. Immunoblots were probed with anti-SCOT antibody. Top panel, 13 μg (lane 6) or 20 μg of whole-cell protein/lane (other lanes). (Hum is human islets.) Middle panel, immunoblot with 15 μg of whole-cell protein/lane. Bottom panel, 10 μg of whole-cell protein. The densities of the SCOT protein bands in each panel are expressed relative to the bands within the same panel. Membranes were stripped of antibody and reprobed with anti-β-actin antibody to discern relatively equal loading of protein across the lanes. In the bottom panel, due to the lower protein loaded in the lane of mouse islets, densities of the actin bands are also shown. The ratio of the relative density of the SCOT band to the actin band in the mouse lane shows the level of SCOT in mouse islets is about one-half the level in human islets, similar to in rat islets.
FIGURE 7.
FIGURE 7.
Higher levels of acetoacetyl-CoA synthetase (AACS) protein in human pancreatic islets than in rat and mouse islets. Two immunoblots with 15 μg of whole-cell protein/lane. The level of the enzyme (acetoacetyl-CoA synthetase) is much higher in human islets and INS-1 832/13 cells than in Sprague-Dawley rat islets and islets from the NSA (CF-1) mouse and the C57BL/6 (B6) mouse. Membranes were stripped of antibody and reprobed with anti-β-actin antibody to discern equal loading of protein across the lanes. A human islet lane that showed extremely dark staining was deleted from both panels.
FIGURE 8.
FIGURE 8.
High level of fatty-acid synthase protein in human islets. Immunoblot, 15 μg of whole-cell protein/lane. The level of fatty-acid synthase (FAS) in human islets is as high as in INS-1 832/13 cells and much higher than in rat islets. The level of fatty-acid synthase in rat islets in this same blot was not visible, and the lane with rat islet protein is not shown.
FIGURE 9.
FIGURE 9.
Higher glucose-stimulated acetoacetate in glucose-stimulated human islets than in rat islets. Islets were maintained in tissue culture medium containing 5 mm glucose for 4 h (some human) to 24 h (some human and all rat), washed, and then incubated in Krebs-Ringer bicarbonate buffer, pH 7.35, in the presence or absence of 16.7 mm glucose for 30 min. The figure shows the mean ± S.E. acetoacetate levels from eight separate experiments with 3–4 replicates of 100 rat islets for each condition (left side of figure) and 4–6 replicates of 100–200 islets for each condition from six separate experiments with islets from human donors (P11, C1, UM1, 258, P14, and P15) (middle of figure). Because of the high background fluorescence in the experiments with these six preparations of human islets that were shipped and maintained in media (CMRL or PIM) that contain NAD and NADP (see “Results”), which increased measured acetoacetate values to unrealistic high values, the no addition value for these experiments was assigned zero, and the glucose-stimulated increase in acetoacetate above the control is shown. Results of individual experiments with islets from four additional human donors are shown on the right side of the figure. For these experiments, to lower the background fluorescence, islets were maintained in RPMI 1640 tissue culture medium (modified to contain 5 mm glucose) for 24 h before incubation in the presence or absence of 16.7 mm glucose for 30 min as described above. a, p < 0.01, or b, p < 0.001 glucose-stimulated human islets versus glucose-stimulated rat islets. The mean ± S.E. BMI and age of the human islets donors whose islets were used for these measurements were 26.2 ± 1.6 kg/m2 and 41.7 ± 5.3 years.
FIGURE 10.
FIGURE 10.
Lower glucose-stimulated malate in human islets than in rat islets. Malate was measured in the extracts from the experiments described in Fig. 9. Results are the mean ± S.E. of three experiments with rat islets and eight experiments with islets from human islets donors. a, p = 0.05 glucose-stimulated human islets versus glucose-stimulated rat islets.

References

    1. Henquin J. C., Dufrane D., Nenquin M. (2006) Diabetes 55, 3470–3477 - PubMed
    1. Brunengraber H., Roe C. R. (2006) J. Inherit. Metab. Dis. 29, 327–331 - PubMed
    1. MacDonald M. J., Fahien L. A., Brown L. J., Hasan N. M., Buss J. D., Kendrick M. A. (2005) Am. J. Physiol. Endocrinol. Metab. 288, E1–E15 - PubMed
    1. MacDonald M. J. (1995) J. Biol. Chem. 270, 20051–20058 - PubMed
    1. Farfari S., Schulz V., Corkey B., Prentki M. (2000) Diabetes 49, 718–726 - PubMed

Publication types

LinkOut - more resources