

Signal evolution and infarction risk for apparent diffusion coefficient lesions in acute ischemic stroke are both time- and perfusion-dependent
- PMID: 21454821
- PMCID: PMC3384724
- DOI: 10.1161/STROKEAHA.110.610501
Signal evolution and infarction risk for apparent diffusion coefficient lesions in acute ischemic stroke are both time- and perfusion-dependent
Abstract
Background and purpose: This study aimed to examine the temporal relationship between tissue perfusion and apparent diffusion coefficient (ADC) changes within 6 hours of ischemic stroke onset and how different reperfusion patterns may affect tissue outcome in ADC lesions.
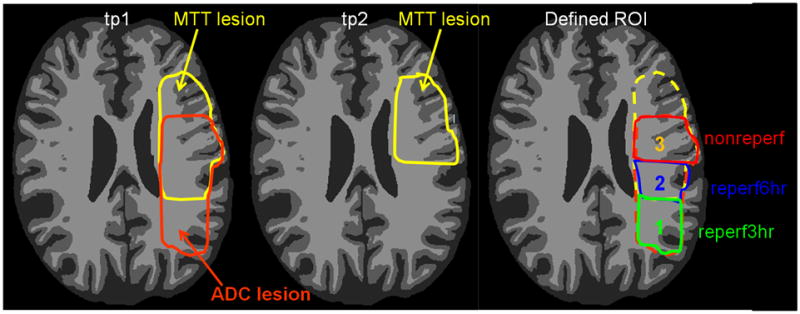
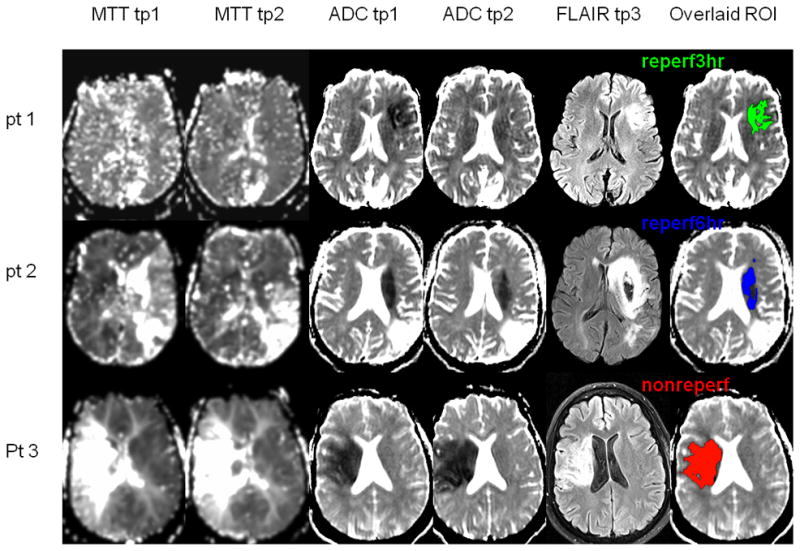
Methods: Thirty-one participants were sequentially imaged at 3 hours, 6 hours, and 1 month post-stroke. Three regions of interest (ROIs) were defined within initial ADC lesions: ROI (1)reperf_3hour hyperacute reperfusion (within 3 hours), ROI (2)reperf_6hour acute reperfusion (3 to 6 hours), and ROI (3)nonreperf no reperfusion (by 6 hours). For each ROI, changes in ADC (ΔADC) from 3 to 6 hours and risks of infarction were examined.
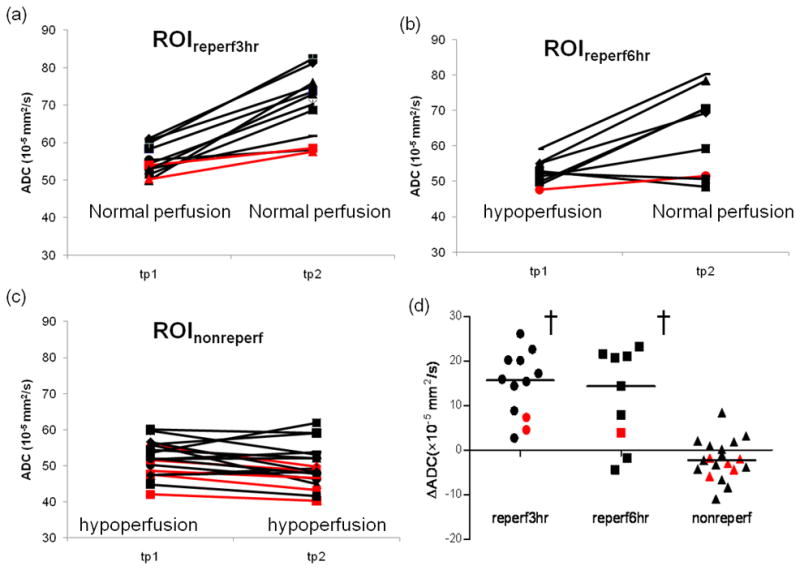
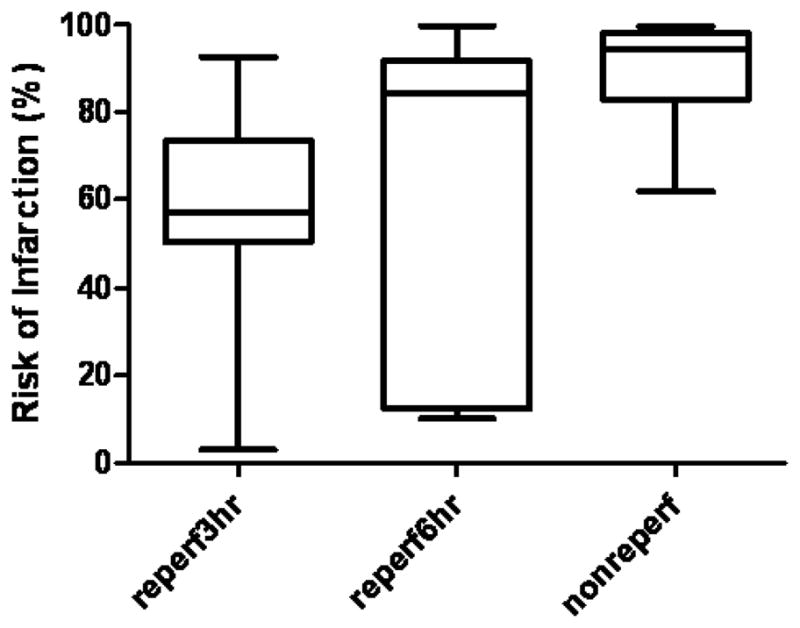
Results: The magnitude of initial ADC reduction was similar in all 3 ROIs (P=0.51). ΔADC was strongly associated with reperfusion (P<0.0001) but not with initial ADC reduction (P=0.83). ΔADC in ROI (1)reperf_3hour and ROI (2)reperf_6hour was significantly larger than that of ROI (3)nonreperf (P<0.05). Positive ΔADC was obtained from 3 to 6 hours in ROI (1)reperf_3hour that had restored perfusion before 3 hours, demonstrating a temporal delay between reperfusion and ADC changes. Risks of infarction were significantly higher in ROI (3)nonreperf than those in ROI (1)reperf_3hour and ROI (2)reperf_6hour.
Conclusions: Improvement in ADC did not occur coincidently with reperfusion but showed a temporal delay. Regions with similar initial ADC reductions at 3 hours had different evolution of ADC and infarction risks depending on when or if tissue reperfused. These findings provide a physiological basis for the observation that a single ADC measurement at a fixed time after stroke onset may not accurately predict tissue outcome.
Figures
References
-
- Lin W, Lee JM, Lee YZ, Vo KD, Pilgram T, Hsu CY. Temporal relationship between apparent diffusion coefficient and absolute measurements of cerebral blood flow in acute stroke patients. Stroke. 2003;34:64–70. - PubMed
-
- Guadagno JV, Jones PS, Fryer TD, Barret O, Aigbirhio FI, Carpenter TA, Price CJ, Gillard JH, Warburton EA, Baron JC. Local relationships between restricted water diffusion and oxygen consumption in the ischemic human brain. Stroke. 2006;37:1741–1748. - PubMed
-
- Moseley ME, Mintorovitch J, Cohen Y, Asgari HS, Derugin N, Norman D, Kucharczyk J. Early detection of ischemic injury: Comparison of spectroscopy, diffusion-, t2-, and magnetic susceptibility-weighted mri in cats. Acta Neurochir Suppl (Wien) 1990;51:207–209. - PubMed
-
- Kidwell CS, Saver JL, Mattiello J, Starkman S, Vinuela F, Duckwiler G, Gobin YP, Jahan R, Vespa P, Kalafut M, Alger JR. Thrombolytic reversal of acute human cerebral ischemic injury shown by diffusion/perfusion magnetic resonance imaging. Ann Neurol. 2000;47:462–469. - PubMed
-
- Chalela JA, Kang DW, Luby M, Ezzeddine M, Latour LL, Todd JW, Dunn B, Warach S. Early magnetic resonance imaging findings in patients receiving tissue plasminogen activator predict outcome: Insights into the pathophysiology of acute stroke in the thrombolysis era. Ann Neurol. 2004;55:105–112. - PubMed
Publication types
MeSH terms
Grants and funding
LinkOut - more resources
Full Text Sources
Medical
