. 2011 Mar 24;6(3):e18017.
doi: 10.1371/journal.pone.0018017.

Regulation of glioblastoma progression by cord blood stem cells is mediated by downregulation of cyclin D1

Affiliations

Regulation of glioblastoma progression by cord blood stem cells is mediated by downregulation of cyclin D1

Kiran Kumar Velpula et al. PLoS One. .

Abstract

Background: The normal progression of the cell cycle requires sequential expression of cyclins. Rapid induction of cyclin D1 and its associated binding with cyclin-dependent kinases, in the presence or absence of mitogenic signals, often is considered a rate-limiting step during cell cycle progression through the G(1) phase.

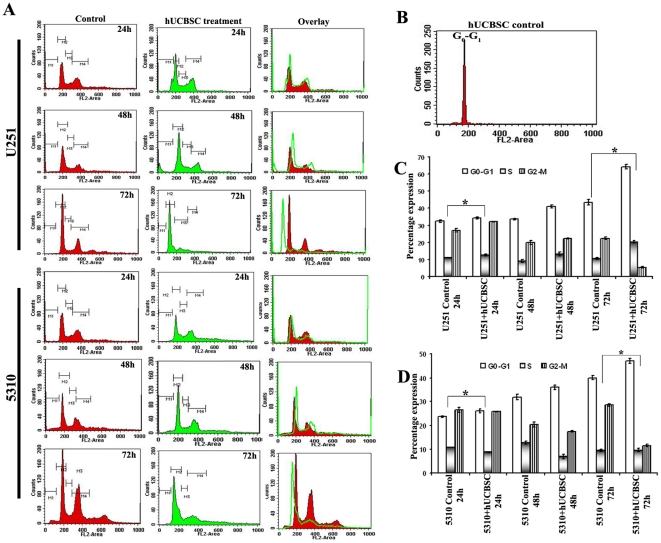
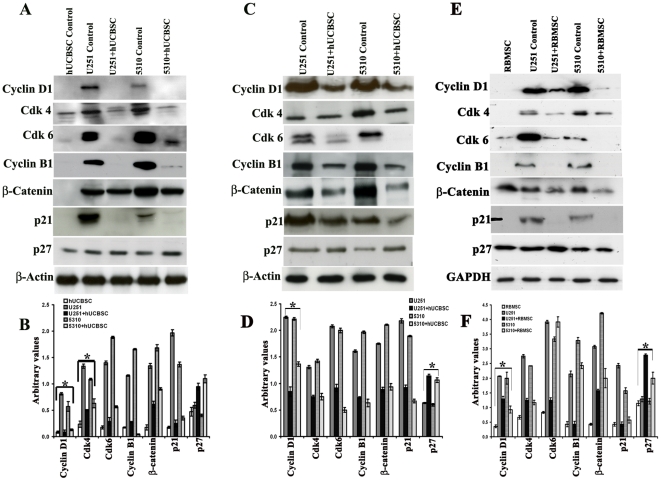
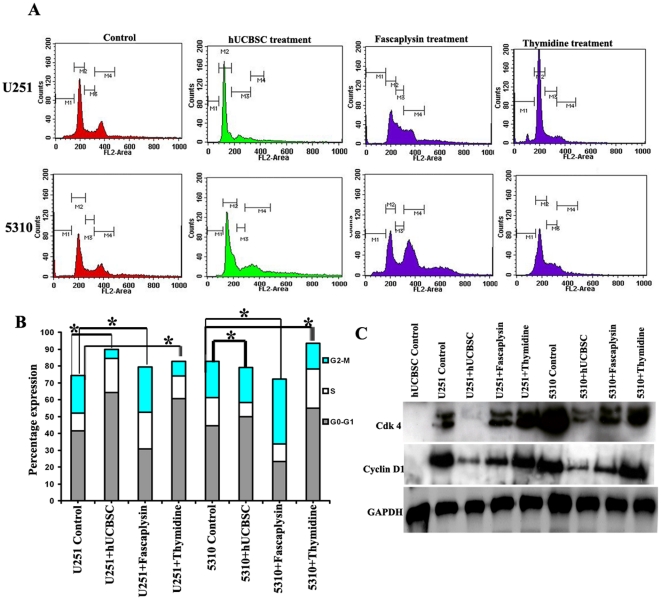
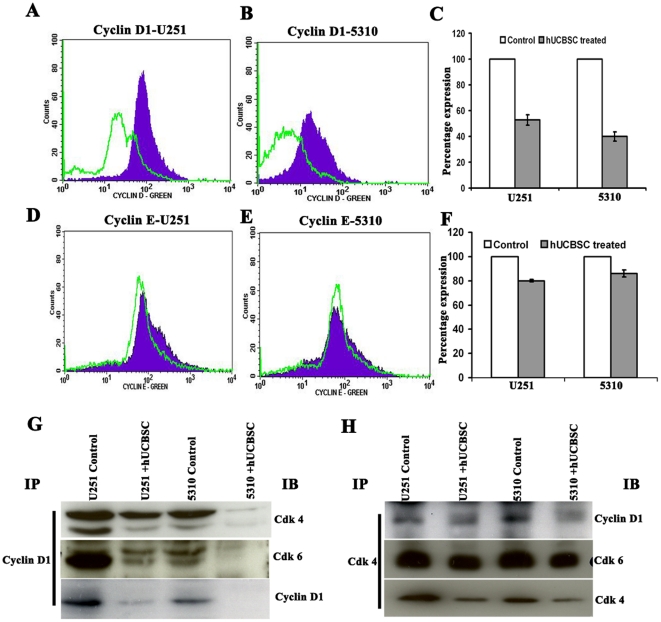
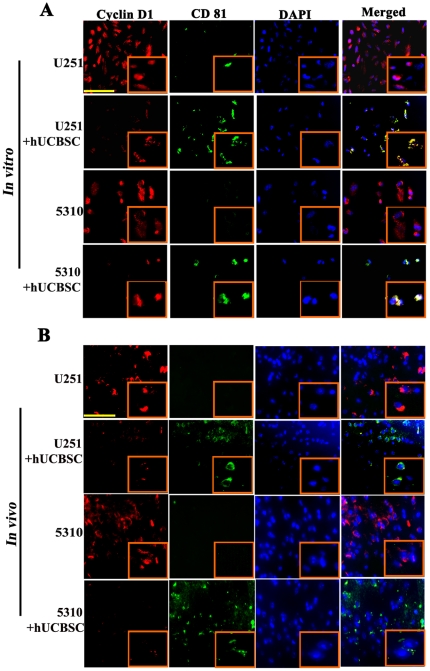
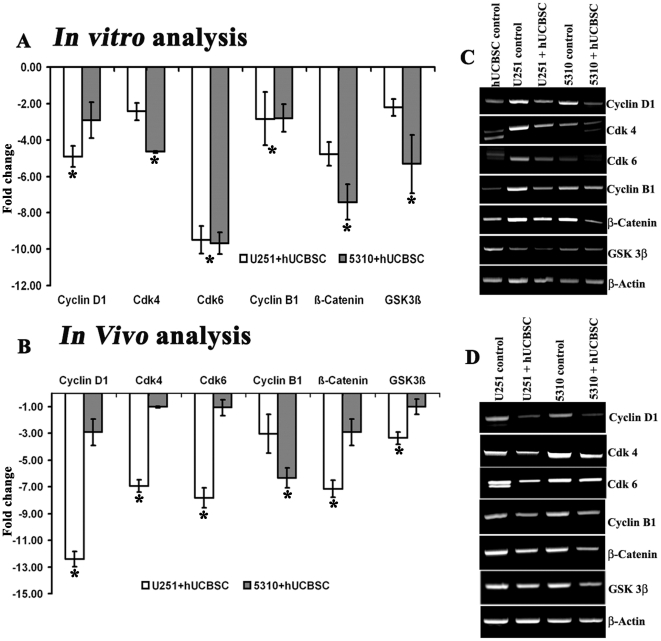
Methodology/principal findings: In the present study, human umbilical cord blood stem cells (hUCBSC) in co-cultures with glioblastoma cells (U251 and 5310) not only induced G(0)-G(1) phase arrest, but also reduced the number of cells at S and G(2)-M phases of cell cycle. Cell cycle regulatory proteins showed decreased expression levels upon treatment with hUCBSC as revealed by Western and FACS analyses. Inhibition of cyclin D1 activity by hUCBSC treatment is sufficient to abolish the expression levels of Cdk 4, Cdk 6, cyclin B1, β-Catenin levels. Our immuno precipitation experiments present evidence that, treatment of glioma cells with hUCBSC leads to the arrest of cell-cycle progression through inactivation of both cyclin D1/Cdk 4 and cyclin D1/Cdk 6 complexes. It is observed that hUCBSC, when co-cultured with glioma cells, caused an increased G(0)-G(1) phase despite the reduction of G(0)-G(1) regulatory proteins cyclin D1 and Cdk 4. We found that this reduction of G(0)-G(1) regulatory proteins, cyclin D1 and Cdk 4 may be in part compensated by the expression of cyclin E1, when co-cultured with hUCBSC. Co-localization experiments under in vivo conditions in nude mice brain xenografts with cyclin D1 and CD81 antibodies demonstrated, decreased expression of cyclin D1 in the presence of hUCBSC.

Conclusions/significance: This paper elucidates a model to regulate glioma cell cycle progression in which hUCBSC acts to control cyclin D1 induction and in concert its partner kinases, Cdk 4 and Cdk 6 by mediating cell cycle arrest at G(0)-G(1) phase.


Conflict of interest statement

Competing Interests: The authors have declared that no competing interests exist.

Figures

Figure 1
Figure 1. Effect of hUCBSC on cell cycle progression of glioma cells U251 and 5310. (A)
Approximately 1×10⁶ cells of U251 and 5310 cells were co-cultured with hUCBSC. Samples were harvested for every 24 h till 72 h to study the percentage of different phases of glioma cell cycle upon hUCBSC treatment. Adherent and detached cells were harvested, pooled, washed once in phosphate-buffered saline (PBS). Cells were treated with propidium iodide at a concentration of 50 µg/ml. After incubation at room temperature for 10–20 min, cells were analyzed for cell cycle distribution with a FACS Calibur flow cytometer (fluorescence-activated cell sorter; FACS) and CellQuest software (Becton Dickinson). Cells with DNA content between 2N and 4N were designated as being in the G1, S, or G2/M phase of the cell cycle. The number of cells in each compartment of the cell cycle was expressed as a percentage of the total number of cells present. Data shown was obtained from three independent experiments before calculating means and standard deviations. M1, M2, M3 and M4 represent the apoptosis, G0-G1, S and G2-M phases of the cell cycle respectively. (B) hUCBSC were trypsinized, harvested and washed with two volumes of PBS and were processed for FACS analysis as mentioned above. Bar graph representing the kinetics and different phases of cell cycle at different time points in U251 (C), 5310 (D) and hUCBSC alone and in co-culture. *Significant at p<0.05. n≥3.
Figure 2
Figure 2. Effect of co-culturing hUCBSC on the expression of various cell cycle proteins and their upstream molecules in U251 and 5310 cells.
(A) Western blotting of in vitro and in vivo samples. Briefly, cell lysates from in vitro samples (1×10⁶ cells) were prepared from U251 and 5310 cells alone and in co-culture with hUCBSC after 72 h. Cell lysates were prepared as described previously. Western blotting was carried out to determine the effect of hUCBSC on cyclin D1, cyclin B1, Cdk 4, Cdk 6, upstream molecules like β-Catenin and other cell cycle regulatory proteins like p21 and p27. (B) Quantitative estimation of figure A. (C) In vivo expression was studied by loading equal amounts of protein (40 µg) from tissue lysates of untreated and treated mice brains onto 12% SDS PAGE gels. Around 40 µg of total soluble protein were loaded onto 12% SDS PAGE gels. The transferred proteins were then probed with respective antibodies. β-actin is served as the loading control. Each experiment was repeated 3 times. (D) Quantitative estimation of figure C. (E) Single and co-cultures of glioma cells with rat bone marrow stromal cells. ∼40 mg of total protein lysate were loaded onto 12% gels and transferred onto nitrocellulose membranes and probed with respective antibodies. Immuno reactive bands were visualized using chemiluminescence ECL western blotting detection reagents and the reaction was detected using Hyperfilm-MP autoradiography film. GAPDH is served as the loading control. Each experiment was repeated three times. (F) Quantitative data of figure E. *Significant at p<0.05. n≥3.
Figure 3
Figure 3. Effect of Fascaplysin and thymidine treatment on glioma cell cycle.
(A) Cell cycle analysis was done to visualize and study the different phases of cell cycle observed when U251 and 5310 cells were co-cultured with hUCBSC. Control and co-cultured cells were harvested and stained. The data depicted here was collected from 10000 events. FACS analysis was done to assess fascaplysin reduction of various cell cycle phases in U251 and 5310 cells, treated for 72 h with 1 µM fascaplysin. Synchronous cell cycle progression of G1-synchronized cells was studied using 4 mM thymidine. Cells were harvested, fixed and stained with propidium iodide. Cells were observed to be synchronized in the G0-G1 phase. The G1 and G2M populations marked were visualized after staining with propidium iodide. M1, M2, M3 and M4 represent the apoptosis, G0-G1, S and G2-M phases of the cell cycle respectively. (B) Bar graph indicating the cell cycle distributions of U251 and 5310 cells, when treated with 1.0 µM fascaplysin, 4.0 mM thymidine in separate experiments were analyzed by FACS. *Significant at p<0.05. (C) U251 and 5310 cells were treated for 24 h with 1 µM fascaplysin. The cyclin D1 and Cdk 4 levels were analyzed by western blotting. In another experiment, the glioma cells U251 and 5310 were treated with 4.0 mM thymidine and the cell lysates were analyzed for the presence of cyclin D1 and Cdk 4 by using Western blotting with the indicated antibodies. GAPDH was used as a loading control.
Figure 4
Figure 4. Flow cytometry analysis for expression of cyclins D1 and E.
(A) and (B) Expression of cyclin D1 in U251 and 5310 alone and in co-cultures with hUCBSC as assessed by flow cytometry. Cyclins D1 and E expression was determined by staining with the mAb to human cyclin D1, E or isotype control mouse or rabbit IgG1, and then followed by a secondary antibody goat anti-mouse IgG or anti-rabbit IgG conjugated to Alexa Fluor green dye. The background has been subtracted using different isotypic controls for respective antibodies. (D) and (E) Expression of cyclin E in U251 and 5310 control cells and in co-cultures with hUCBSC. (C) and (F) Bar graphs representing the percent expression levels of cyclin D1 and E when compared with the normalized control. (G) Around 600 µg of total soluble protein was taken from U251 and 5310 control cells and hUCBSC-treated tissue lysates. The protein samples were incubated with 2 µg/ µl of Cdk 4 and cyclin D1 antibody. The mixture containing total soluble protein and respective antibody was incubated with 50 µL of protein A/G agarose beads for 30’ in ice. The Cdk 4-immunoprecipitated blot was immunoblotted against cyclin D1, Cdk 6 and Cdk 4, while the cyclin D1-immunoprecipitated blot was immunoblotted against Cdk 4, Cdk 6 and cyclin D1.
Figure 5
Figure 5. hUCBSC treatment downregulates cyclin D1 in vitro and in vivo.
(A) Immunocytochemistry of single and co-cultures of U251 and 5310 cells for the expression of cyclin D1 and CD81. Cyclin D1 is conjugated with Alexa Fluor-594 (red), and CD81 is conjugated with Alexa Flour-488 (green). Inset pictures show magnified images. Bar = 200 µm (B) Nude mice with pre-established intracranial human glioma tumors (U251 or 5310) were treated with hUCBSC by intracranial injection (2×10⁵). Fourteen days after hUCBSC administration, the brains were harvested and sectioned and immunoprobed for cyclin D1 and appropriate secondary antibodies. Inset pictures show magnified images. Bar  = 200 µm. Each experiment was performed in triplicates with each sample (n = 3).
Figure 6
Figure 6. cDNA PCR microarray expression data and quantitative RT-PCR data for the differentially expressed genes in vitro and in vivo.
(A) and (B) Genes downregulated in hUCBSC-treated U251 and 5310 cells and compared to control glioma cells. We used microarrays of cDNA clones selected from a cell cycle library to identify genes that were downregulated using the cDNA prepared from the above mentioned cell lysates. X-axis represents expression level in arbitrary units with the expressed genes on the y-axis. All the data presented here are from experiments performed in triplicate (n = 3). Expression of cyclin D1, cyclin B1, Cdk 4, Cdk 6, β-Catenin and Gsk-3β mRNAs under (C) in vitro and (D) in vivo conditions. β-actin is used as loading control. *Significant at p<0.05.

References

    1. Walker AE, Robins M, Weinfeld FD. Epidemiology of brain tumors: the national survey of intracranial neoplasms. Neurology. 1985;35:219–226. - PubMed
    1. Surawicz TS, Davis F, Freels S, Laws ER, Jr, Menck HR. Brain tumor survival: results from the National Cancer Data Base. J Neurooncol. 1998;40:151–160. - PubMed
    1. Donato V, Papaleo A, Castrichino A, Banelli E, Giangaspero F, et al. Prognostic implication of clinical and pathologic features in patients with glioblastoma multiforme treated with concomitant radiation plus temozolomide. Tumori. 2007;93:248–256. - PubMed
    1. Kang SG, Kim JH, Nam DH, Park K. Clinical and radiological prognostic factors of anaplastic oligodendroglioma treated by combined therapy. Neurol Med Chir (Tokyo) 2005;45:232–238. - PubMed
    1. Stupp R, Mason WP, van den Bent MJ, Weller M, Fisher B, et al. Radiotherapy plus concomitant and adjuvant temozolomide for glioblastoma. N Engl J Med. 2005;352:987–996. - PubMed

Publication types

MeSH terms