. 2011 Sep 1;519(13):2546-73.
doi: 10.1002/cne.22638.

Colocalization of hyperpolarization-activated, cyclic nucleotide-gated channel subunits in rat retinal ganglion cells

Affiliations

Colocalization of hyperpolarization-activated, cyclic nucleotide-gated channel subunits in rat retinal ganglion cells

Tyler W Stradleigh et al. J Comp Neurol. .

Abstract

The current-passing pore of mammalian hyperpolarization-activated, cyclic nucleotide-gated (HCN) channels is formed by subunit isoforms denoted HCN1-4. In various brain areas, antibodies directed against multiple isoforms bind to single neurons, and the current (I(h)) passed during hyperpolarizations differs from that of heterologously expressed homomeric channels. By contrast, retinal rod, cone, and bipolar cells appear to use homomeric HCN channels. Here, we assess the generality of this pattern by examining HCN1 and HCN4 immunoreactivity in rat retinal ganglion cells, measuring I(h) in dissociated cells, and testing whether HCN1 and HCN4 proteins coimmunoprecipitate. Nearly half of the ganglion cells in whole-mounted retinae bound antibodies against both isoforms. Consistent with colocalization and physical association, 8-bromo-cAMP shifted the voltage sensitivity of I(h) less than that of HCN4 channels and more than that of HCN1 channels, and HCN1 coimmunoprecipitated with HCN4 from membrane fraction proteins. Finally, the immunopositive somata ranged in diameter from the smallest to the largest in rat retina, the dendrites of immunopositive cells arborized at various levels of the inner plexiform layer and over fields of different diameters, and I(h) activated with similar kinetics and proportions of fast and slow components in small, medium, and large somata. These results show that different HCN subunits colocalize in single retinal ganglion cells, identify a subunit that can reconcile native I(h) properties with the previously reported presence of HCN4 in these cells, and indicate that I(h) is biophysically similar in morphologically diverse retinal ganglion cells and differs from I(h) in rods, cones, and bipolar cells.


Figures

Figure 1
Figure 1
Western blots of retinal membrane proteins. Lanes probed with NeuroMab monoclonal (lanes 3, 4) or Millipore polyclonal (lanes 1, 2, 5, 6) anti-HCN4 or anti-HCN1 antibodies. Ticks and numbers at left show migration distance and molecular weight (in kD) of standard proteins. Anti-HCN4 antibody (lanes 2, 3) binds to protein at around 137 kD. Anti-HCN1 antibody (lanes 4, 5) binds to protein at around 104 kD. Paired Millipore lanes (1 vs 2 and 5 vs 6) were processed identically except that lanes 2 and 5 were incubated in raw antibody, while lanes 1 and 6 were incubated in antibody that was preincubated in immunogen. Suppression of binding by immunogen provides negative controls against non-specific binding.
Figure 2
Figure 2
Western blots of immunoprecipitated HCN1 and HCN4 proteins before and after cleavage by PNGase F. Formatted and labeled as in Figure 1. Retinal membrane proteins were immunoprecipitated with anti-HCN1 and anti-HCN4 antibodies. Samples of each were subjected to cleavage by PNGase F, and electrophoresed on SDS gels with control samples in adjacent lanes. Anti-HCN1 antibody binds to protein at around 108 kD and 100 kD in control HCN1 sample (lane 2) and to a band at around 100 kD in the PNGase F-treated HCN1 sample (lane 1). Anti-HCN4 antibody binds to protein at around 148 kD in control HCN4 sample (lane 3) and to protein at around 141 kD in the HCN4 sample incubated with PNGase F (lane 4). The lanes of each pair (1 and 2, 3 and 4) were adjacent lanes during the SDS-PAGE and not separated during any of the subsequent processing.
Figure 3
Figure 3
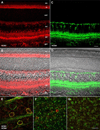
Differential binding of anti-HCN1 and anti-HCN4 antibodies. Transretinal vibratome sections incubated in (A) anti-HCN1 primary antibody and AF568-conjugated goat anti-mouse secondary antibody, or (C) anti-HCN4 primary antibody and AF488-conjugated goat anti-mouse secondary antibody. Paired panels show single optical sections (A, C) of fields under epifluorescence illumination, and after merging these with the same fields under differential interference contrast optics (B, D). Acronyms positioned at the outer segment (os), inner segment (is), outer nuclear (onl), inner nuclear (inl), inner plexiform (ipl), and ganglion cell (gcl) layers. Scale bar in C is 20 µm, and applies to panels AD. Panels E–G are single optical sections through flat-mounted retina after incubation in anti-HCN1 primary and DyLight 649-conjugated secondary, followed by anti-HCN4 primary and DyLight 549-conjugated secondary. Z-stack extends from the ganglion cell layer (E), through the proximal border (F) and middle (G) of the inner nuclear layer. Fluorescence of DyLight 549 and 649 assigned to the green and red color channels, respectively, and merged to form each panel. Green and red colocalize to some individual ganglion cell layer somata (yellow outlines in E), yet localize to separate somata in the inner nuclear layer (F, G). Green dots in F are profiles of bipolar cell axons projecting into the inner plexiform layer from somata in the inner nuclear layer. Scale bar in G is 20 µm, and applies to panels EG. A magenta-green copy of this figure is available on-line as a Supplementary figure.
Figure 4
Figure 4
Colocalization of HCN1 and HCN4 in dextran-backfilled ganglion cells. Panels A–C show a single optical section through the ganglion cell layer after ganglion cells were retrogradely filled with fluorescein-conjugated dextran, and the retina was incubated in anti-HCN1 primary and DyLight 649-conjugated secondary, followed by anti-HCN4 primary and DyLight 549-conjugated secondary. D merges panels AC. Fluorescence from DyLight 649 (A), DyLight 549 (B), and fluorescein (C), assigned to the red, green, and blue color channels, respectively. Yellow in D shows colocalization of HCN1- and HCN4-like immunoreactivities, e.g., circumscribing blue somatic profiles. White shows colocalization of fluorescein with HCN1- and HCN4-like immunoreactivities, e.g. in axon fascicles between the somata. Presence of HCN1 and HCN4 in somata lacking retrograde label (e.g., cell pointed at by arrow labeled H) is consistent with binding to displaced amacrine cells (Perry, 1981). Paired panels E–H show HCN1- and HCN4-like immunoreactivities of somata pointed out by correspondingly lettered arrows in D. Note that both signals are intense in some cells (e.g., E and H), and that HCN4 can be either more (G) or less (F) intense and uniform than HCN1 in other cells. Arrowheads in G and F point at faint membrane staining for HCN1 and HCN4, respectively. Panels I–K show a different field of the same retina as in A–D, processed as a control for non-specific binding of multiple secondary antibodies. Ganglion cells were retrogradely filled with fluorescein-conjugated dextran, and the retina was incubated in monoclonal anti-HCN1 primary and DyLight 649-conjugated secondary, followed by DyLight 549-conjugated secondary. As in A–D, I and J are single optical sections of the ganglion cell layer with fluorescence from DyLight 649 and DyLight 549 assigned to the red and green color channels, respectively. K merges I and J with the fluorescein fluorescence of the same field (blue color channel). Lack of green in J, and of yellow in K, indicate lack of binding of the second secondary antibody in the absence of a second primary antibody after saturation of the first primary antibody by the first secondary antibody. Scale bars are 20 µm in A (same for A–C, I–K), 20 µm in D, and 10 µm in H (same for E–H). A magenta-green copy of this figure is available on-line as a Supplementary figure.
Figure 5
Figure 5
Ratio (R:G) of the mean intensity in the red and green channels of individual HCN-immunopositive ganglion cells. Panels A–C show single optical sections through the ganglion cell layer of a flat-mounted retina, immunostained as in Figure 4 and displayed without the fluorescein fluorescence. Central (A), mid peripheral (B), and far peripheral (C) regions (note change in nerve fiber fascicle thickness with eccentricity). Scale bar in C is 20 µm, and applies to panels AC. Panel E is a scatterplot of R:G of ganglion cells in 10 fields (AC plus fields in other identically processed retinae) against equivalent soma diameter. These ratios show no dependence on soma diameter (r2=0.0067) and most cells display an R:G of approximately 1 (mean=0.99, SD=100.09, n=260) regardless of cell size. Panel D shows ganglion cell somata (n=19) selected from AC, after digitally deleting pixel color in the cytoplasmic and extracellular spaces. The number below each resulting cell membrane image is its R:G. Membranes appear yellow (or present an equal mix of red and green) in examples presenting R:G between 0.9 and 1.1, predominantly green at ratios less than 0.4, and predominantly red at ratios greater than 6. Panel F is a histogram of the membrane R:G for all ganglion cells in AC. The median is 1.08, and the smooth line plots a normal distribution around the mean (mean=1.29, variance=100.14). A magenta-green copy of this figure is available on-line as a Supplementary figure.
Figure 6
Figure 6
Effect of cAMP on rat retinal ganglion cell Ih at 35 °C. Perforated-patch whole-cell recordings without leak subtraction. A–C, Shift of Ih voltage-sensitivity by 8-bromo-cAMP. Ih activated in a single ganglion cell by hyperpolarizations from the holding potential (−62 mV) to −67, −72, −77, −82, −87, −92, and −97 mV, while the superfusate was changed from control (A1), to 300 µM 8-bromo-cAMP (A2), to control solution again (A3), and then to 100 µM SQ22536 (A4). Steps above current traces show stimulus timing. B1B4 display the first 1.25 sec of the deactivating portion of these currents in grey, normalized to the largest current measured in each solution and fitted by the sum of two exponential time functions (see Materials and Methods). The smooth black lines plot the first 1.25-sec portion of the fit to the entire record of tail current (A1A4). C, Activation range measured by normalizing the amplitude of these currents against the maximum recorded in each solution, and plotting the normalized amplitudes against activating voltage with best-fits by a Boltzmann equation (smooth curves). Empty circles, grey dots, Xs, and black dots plot current amplitudes in control, 8-bromo-cAMP, wash, and SQ22536, respectively. Amplitudes measured at 50 msec after each repolarization to the holding potential. The fits indicate V1/2 and s values of −72.1 mV and 7.5 in control, −67.5 mV and 7.6 in cAMP, and −73.6 mV and 7.4 in wash, and −76.1 and 8.2 in SQ22536. D, Open circles, grey dots, and black dots plot mean tail current amplitude for all cells recorded from (n=5) in control, 8-bromo-cAMP, and SQ22536, respectively. Error bars plot ± SEM; those not visible are within the symbols. Fits by Boltzmann equation (smooth curves) yield V1/2 and s values of −73.7 mV and 7.1 in control, −69.1 mV and 7.4 in cAMP, and −76.9 mV and 6.7 in SQ22536. EF plot the fast time constant (τf) and the relative contribution of the fast component [Af/(Af+As)], respectively, from fits of the sum of two exponential time functions to Ih measured at −92 mV. Values plotted against whole-cell membrane capacitance of cells recorded in control external solution (n=25). Insets plot these values against the fraction of the cells recorded from. Light grey lines mark the median and the dark grey lines show the 5th and 95th percentiles (thus marking the range of values measured in 90% of the cells).
Figure 7
Figure 7
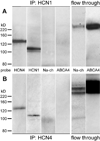
Coimmunoprecipitation of HCN1 and HCN4. Identically prepared samples of retina membrane proteins were immunoprecipitated with protein G or protein A beads bearing antibodies against HCN1 (mouse monoclonal) or HCN4 (rabbit polyclonal), respectively. The immunoprecipitated proteins ("pull-down" fraction) were then tested for binding of anti-HCN1 and anti-HCN4 antibodies. To assess specificity, the pull-down fraction and the supernatant above the beads ("flow-through") were tested for binding of antibodies against other retinal membrane proteins (ABCA4 and voltage-gated Na+ channels). A, Immunoprecipitation by NeuroMab anti-HCN1 antibody, then probe with antibodies against proteins listed under each lane. Anti-HCN4 antibody binds to protein at ~138 kD; anti-HCN1 antibodies binds to protein at ~115 kD. A deglycosylated form of the HCN1 subunit protein (~98 kD) also binds the NeuroMab anti-HCN1 antibody (see Fig. 2). B, Immunoprecipitation by Millipore anti-HCN4 antibody, then probe with antibody against proteins listed under each lane. Anti-HCN4 antibody (Millipore) binds to protein at ~138 kD; anti-HCN1 antibody (NeuroMab) binds to protein at ~115 kD. Note that anti-HCN1 and anti-HCN4 antibodies both immunoprecipitate both HCN subunit proteins; that neither antibody immunoprecipitates detectable amounts of ABCA4 or voltage-gated Na+ channel; and that both of these latter proteins were present in the retinal homogenates (viz., in the flow-through lanes). In some lanes (e.g., B), the pan anti-Na+ channel antibody bound protein at two migration distances. Regardless of the antibody used to immunoprecipitate the pull down fraction, no-detectable signals were seen when the polyclonal antibodies used to probe for HCN1 and HCN4 were pre-incubated with immunogens (lanes not shown).
Figure 8
Figure 8
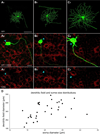
Tangential views. Three views of three ganglion cells (AC) in flat-mounted retinae. Upper row (A1C1) shows GFP fluorescence (green) only in projected views of the dendritic field arborizing in the inner plexiform layer (IPL), the soma in the ganglion cell layer (GCL), and the axon in the nerve fiber layer. The middle row (A2C2) shows the same cells at higher magnification, with the axon extending for at least 100 µm from each soma to the lower right-hand corner of each field. These are displayed without the sections of the dendritic fields and superimposed on single optical sections of the HCN-like immunoreactivity (red). These sections are shown in the bottom row (A3C3, each cropped for space) without the GFP fluorescence. The blue arrows point at the soma of each cell, showing the HCN4-like immunoreactivity of the GFP-expressing soma. Comparison of the three cells shows that the soma, dendritic field, and axon diameters in A1–A2 are all small, those of the cell in C1–C2 are all large, and those of the cell in B1–B2 are small, medium, and small, respectively. Identical magnification in A1C1; calibration mark in A1 is 100 µm. Identical magnification in A2C3; calibration mark in A2 is 20 µm. D: Equivalent diameter of dendritic fields plotted against equivalent diameter of corresponding soma of all GFP-expressing, HCN4-immunopositive cells found in this study. A magenta-green copy of this figure is available on-line as a Supplementary figure.
Figure 9
Figure 9
Orthogonal rotations. Four views of six large-field ganglion cells (A-F). The first three views are formatted as in Figure 8 to show (1) the GFP fluorescence (green) in projected views of the dendritic field, soma, and axon, (2) the soma at higher magnification superimposed on a single optical section of the HCN-like immunoreactivity (red), and (3) the HCN-like immunoreactivity alone. Blue arrowheads point at the GFP-expressing, HCN4-immunopositive somata. The fourth panel for each cell shows the 90° rotation of the GFP-expressing cell superimposed on the fluorescence (purple) localizing choline acetyltransferase-like immunoreactivity (ChAT). The upper and lower sides of these panels are the sclerad and vitread sides of these views, respectively. The round, purple profiles above and below each ganglion cell are the somata of regular and displaced cholinergic amacrine cells, respectively. The dendrites of these cells form the two purple "ChAT bands" in the inner plexiform layer (e.g., right side of A4 and B4, right and left side of C4 and D4, and throughout E4). The monostratified ganglion cell dendrites ramify above the distal ChAT band (A4), at the same level as the distal ChAT band (B4), between the two ChAT bands (C4), at the same level as the proximal ChAT band (D4), and beneath the proximal ChAT band (E4). The multistratified ganglion cell dendrites in F4 spread laterally in the distal half of the IPL. Dendrites of this cell can be seen ascending and descending through the IPL, i.e. passing toward the amacrine cell layer as well as away from it. The calibration mark in each GFP-only panel (A1, B1, etc) shows 100 µm. The calibration marks show 20 µm in the HCN4-only panels (A3, B3, etc.) and are identical for the corresponding GPF-HCN4 fields (A2, B2, etc.). A magenta-green copy of this figure is available on-line as a Supplementary figure.
Figure 10
Figure 10
Dendritic fields. Projected views of the dendritic field, soma, and proximal segment of axon of GFP-expressing, HCN4-immunopositive cells. Each profile shows the GFP fluorescence in black, with the cell type based on resemblance of cell soma diameter, dendritic field diameter, dendritic arborization, and dendritic shape and branching pattern, to types identified by Sun et al. (2002), Peichl (1989), and Bunt (1976). The first three properties of each cell here are listed in Table 2. The dendrites vary from sparse branching (RGB3, outer delta) to numerous branchings (RGC1, RGC2 outer, RGC4 outer, RGD2); thick between soma and first branch point (RGA2 outer, RGA2 inner, RGC1) to thin near soma (RGB2, RGD1, multistratified); few if any spines (RGA2 outer, RGA2 inner, outer delta) to numerous, short spines (RGB2, RGC4 outer). Asterisks positioned next to axon of each cell. Calibration bar is 100 µm and applies to all profiles.
Figure 11
Figure 11
Immunonegative cells, formatted as in Figure 8. The cell types are multistratified (A), RGA1 (B), RGB1 (C), and RGB4 (D). As in Figure 8, each GFP panel is a projected view of the dendrites, soma, and axon, and the axon clearly extends beyond the dendritic field (oriented to touch the right edge). The blue arrowheads in the HCN4 panels show the absence of HCN-like immunoreactivity at the position of the GFP-expressing cell soma in the corresponding GFP+HCN4 panels, despite the presence of HCN4-immunopositive somata in the same field. The calibration bars in the GFP-only fields (A1D1) are 100 µm. For the remaining fields, the calibration bars are 20 µm (shown in the HCN4-only panel of each pair). A magenta-green copy of this figure is available on-line as a Supplementary figure.

Similar articles

Cited by

References

    1. Abbas SY, Ying SW, Goldstein PA. Compartmental distribution of hyperpolarization-activated cyclic-nucleotide-gated channel 2 and hyperpolarization-activated cyclic-nucleotide-gated channel 4 in thalamic reticular and thalamocortical relay neurons. Neurosci. 2006;141:1811–1825. - PubMed
    1. Altomare C, Terragni B, Brioschi C, Milanesi R, Pagliuca C, Viscomi C, Moroni A, Baruscotti M, DiFrancesco D. Heteromeric HCN1–HCN4 channels: a comparison with native pacemaker channels from the rabbit sinoatrial node. J Physiol. 2003;549:347–359. - PMC - PubMed
    1. Barrow AJ, Wu SM. Low-conductance HCN1 ion channels augment the frequency response of rod and cone photoreceptors. J Neurosci. 2009;29:5841–5853. - PMC - PubMed
    1. Bhongsatiern J, Ohtsuki S, Tachikawa M, Hori S, Terasaki T. Retinal-specific ATP-binding cassette transporter (ABCR/ABCA4) is expressed at the choroid plexus in rat brain. J Neurochem. 2005;92:1277–1280. - PubMed
    1. Biel M, Michalakis S. Cyclic nucleotide-gated channels. Handb Exp Pharm. 2009;191:111–136. - PubMed

Publication types

MeSH terms

LinkOut - more resources