. 2011 Jun 1;71(8):813-23.
doi: 10.1002/pros.21297. Epub 2010 Nov 4.

Regression of prostate tumors upon combination of hormone ablation therapy and celecoxib in vivo

Affiliations

Regression of prostate tumors upon combination of hormone ablation therapy and celecoxib in vivo

Parisa Abedinpour et al. Prostate. .

Abstract

Background: Hormonal ablation is the standard of treatment for advanced androgen-dependent prostate cancer. Although tumor regression is usually achieved at first, the cancer inevitably evolves toward androgen-independence, in part because of the development of mechanisms of resistance and in part because at the tissue level androgen withdrawal is not fully attained. Current research efforts are focused on new therapeutic strategies that will increase the effectiveness of androgen withdrawal and delay recurrence. We used a syngeneic pseudo-orthotropic mouse model of prostate cancer to test the efficacy of combining androgen withdrawal with FDA-approved COX-2 inhibitor celecoxib.

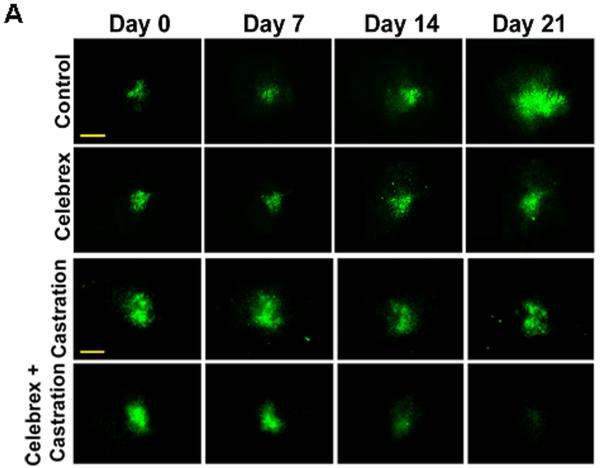
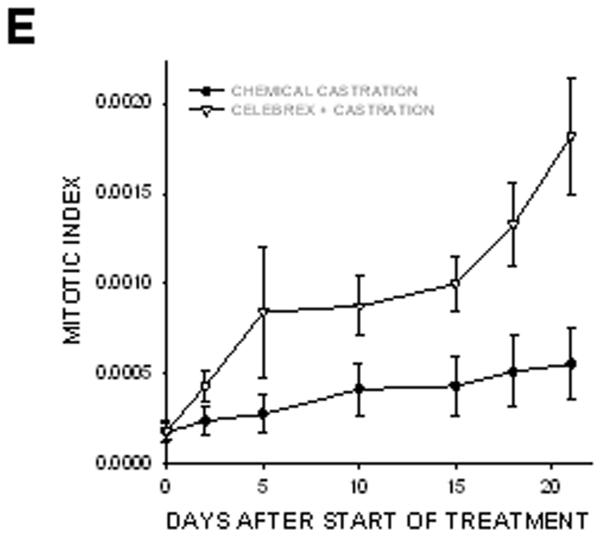
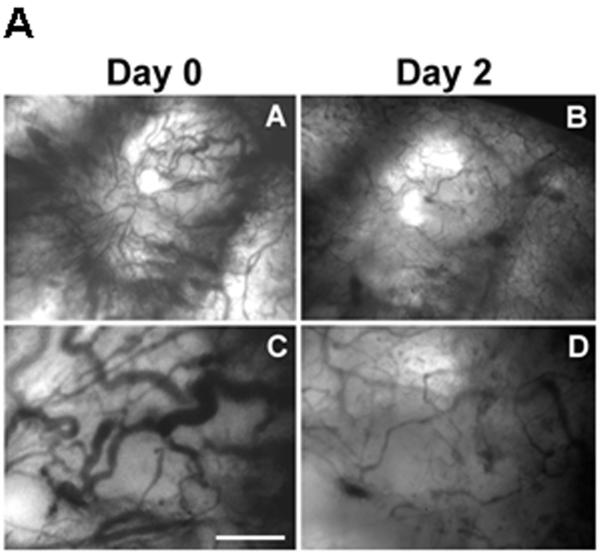
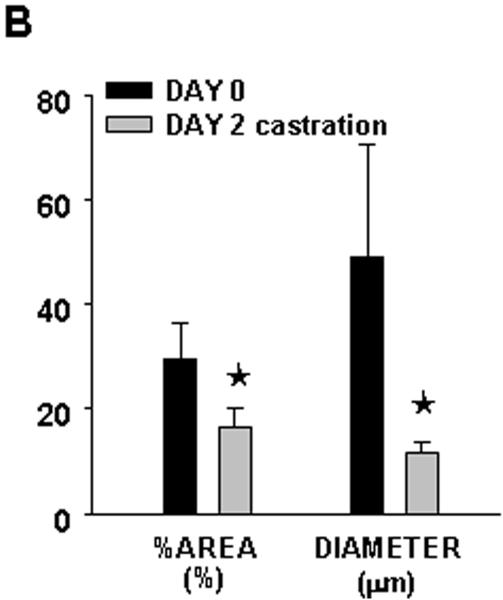
Methods: GFP-tagged TRAMP-C2 cells were co-implanted with prostate tissue in the dorsal chamber model and tumors were allowed to establish and vascularize. Tumor growth and angiogenesis were monitored in real-time using fluorescent intravital microscopy (IVM). Androgen withdrawal in mice was achieved using surgical castration or chemical hormonal ablation, alone or in combination with celecoxib (15 mg/kg, twice daily).

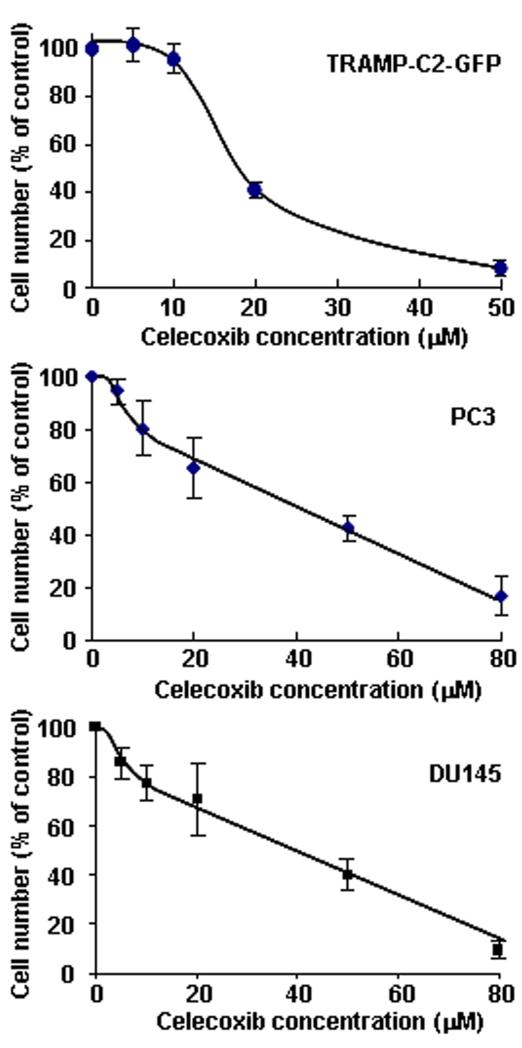
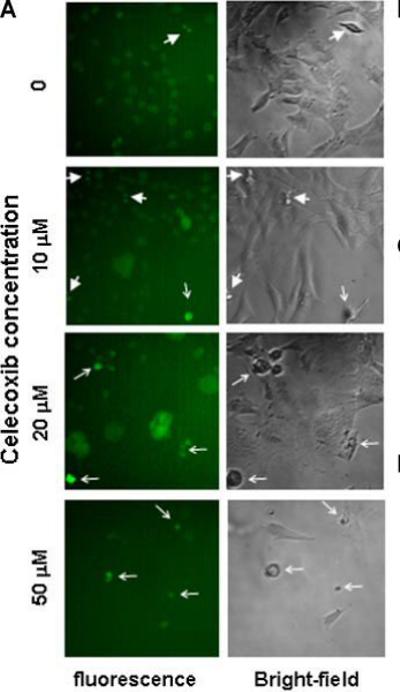
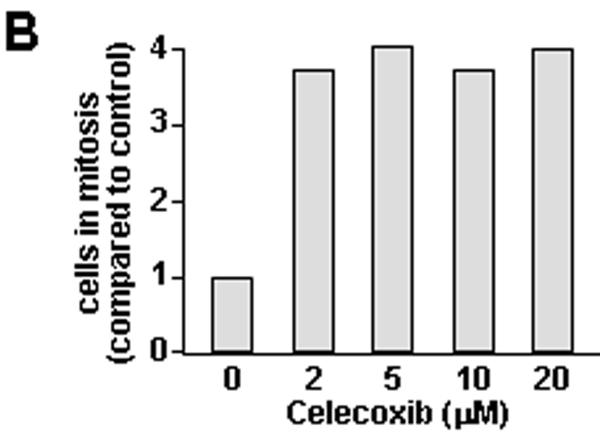
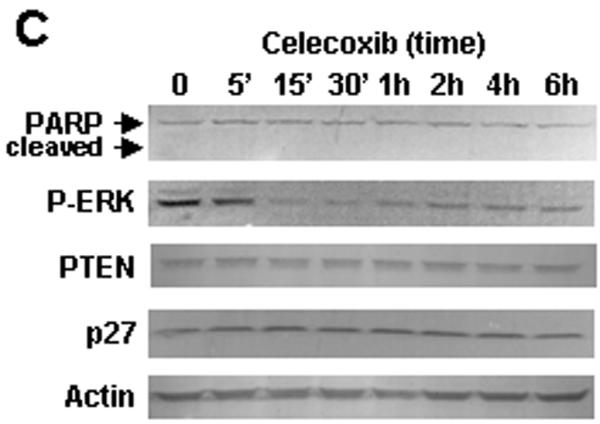
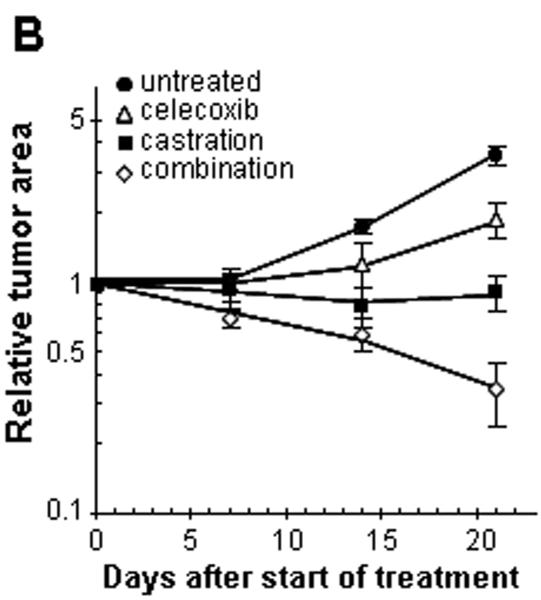
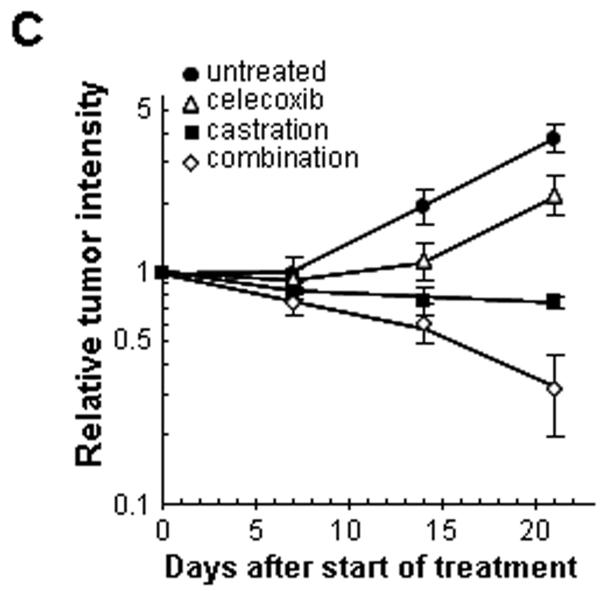
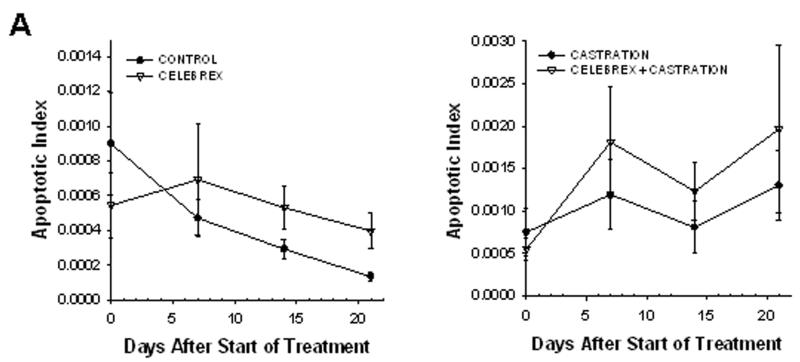
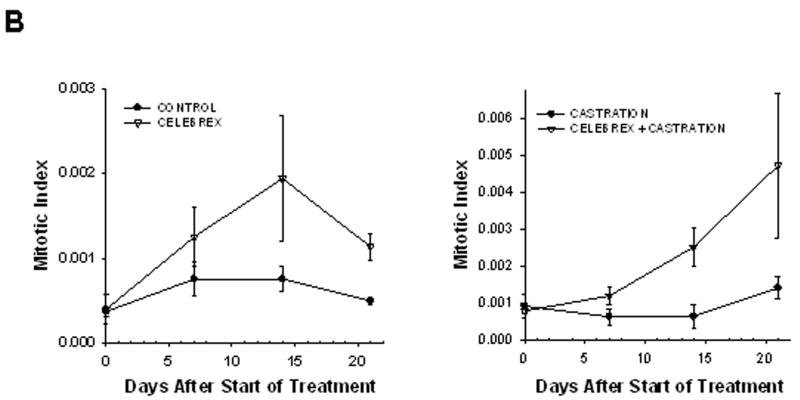
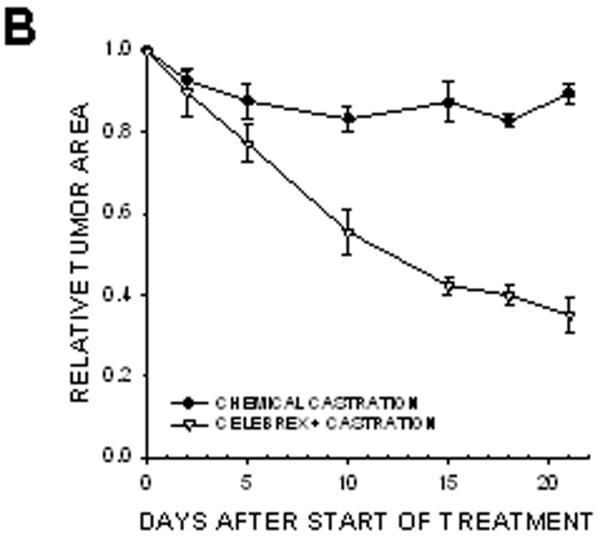
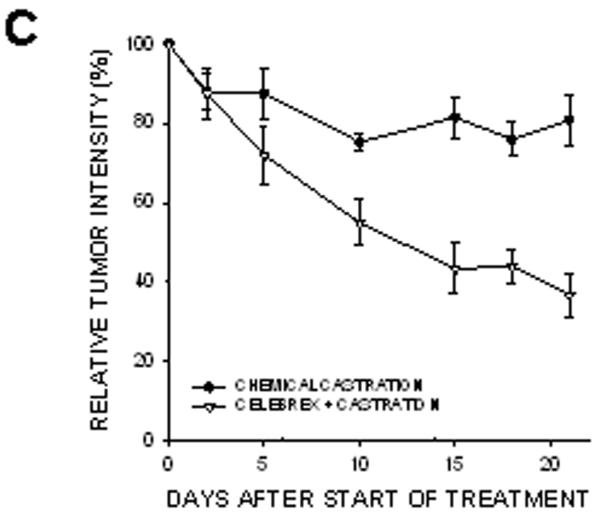
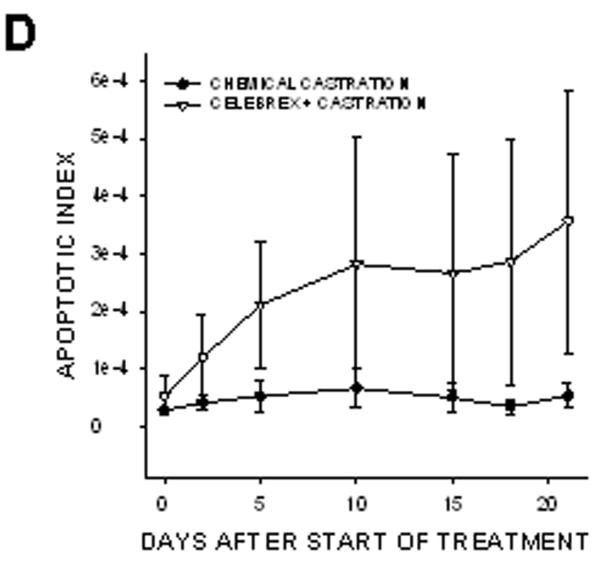
Results: Celecoxib alone decreased the growth of prostate tumors mostly by inducing mitotic failure, which resulted in increased apoptosis. Surprisingly, celecoxib did not possess significant angiostatic activity. Surgical or chemical castration prevented the growth of prostate tumors and this, on the other hand, was associated with disruption of the tumor vasculature. Finally, androgen withdrawal combined with celecoxib caused tumor regression through decreased angiogenesis and increased mitosis arrest and apoptosis.

Conclusion: Celecoxib, a relatively safe COX-2-selective anti-inflammatory drug, significantly increases the efficacy of androgen withdrawal in vivo and warrants further investigation as a complement therapy for advanced prostate cancer.


Figures

Figure 1
Figure 1. Effect of celecoxib on the growth of prostate cancer cells in vitro
Mouse TRAMP-C2 cells stably transfected with H2B-GFP (top panel), as well as human prostate cancer cells PC3 (middle panel) and DU145 (bottom panel), were treated with increasing concentrations of celecoxib for 48 hrs. Cells were counted using a Cell Coulter Multisizer II as described in Methods. Results are expressed relative to untreated cells and are means ± SEM of 3 separate experiments, each done in biological duplicates.
Figure 2
Figure 2. Effect of celecoxib in TRAMP-C2-GFP prostate cancer cells
Panel A: Bright field microscopy (right) and fluorescence microscopy (left) of TRAMP-C2-GFP cells treated with increasing doses of Celecoxib for 48 hrs. Thick arrows point to mitotic cells; thin arrows point to dead cells. Panel B: Cells were treated with the indicated concentrations of celecoxib for 24 hrs. Cells were detached using trypsin, fixed, and co-stained for phospho-H3 (alexa-fluor 488) and DNA content (propidium iodide). The graph shows the proportion of cells in mitosis as compared to control, determined by flow cytometry on Facscan (BD Biosciences). Panel C: TRAMP-C2-GFP cells were treated with 40 μM celecoxib for the indicated times. Cells were lysed and protein expression was analyzed by western blot. Blot membranes were stripped and reprobed using the indicated antibodies. P-ERK: phosphorylation-specific antibodies to ERK. Panel D: TRAMP-C2-GFP cells were incubated in medium with or without androgen and treated with increasing concentrations of celecoxib for 48 hrs before cell counting. Results are expressed relative to untreated cells grown in medium containing androgen, and are means ± SEM of 3 separate experiments, each done in biological triplicate.
Figure 3
Figure 3. Effect of celecoxib and/or surgical castration on prostate tumor growth in vivo
TRAMP-C2-GFP cell spheroids were co-implanted with prostate tissue and allowed to vascularize. When there was proper blood flow within the growing tumors, the mice were surgically castrated (Day 0) and Celecoxib treatment (15 mg/kg/administration) was started by oral administration twice daily. Tumors were imaged by intravital microscopy once a week. Panel A: a representative collage of tumor growth in the four treatment groups. Bar ~ 500μm. Panel B-C: graphic representation of relative tumor areas (B) and relative tumor intensities (C) calculated from intravital microscopy data (log scale).
Figure 4
Figure 4. Mitotic and apoptotic index
Graphic representation of the mean apoptotic index (Panel A) and the mean mitotic index (Panel B) within the tumors, calculated from intravital microscopy data. The animal experiments are the same as described in figure 2.
Figure 4
Figure 4. Mitotic and apoptotic index
Graphic representation of the mean apoptotic index (Panel A) and the mean mitotic index (Panel B) within the tumors, calculated from intravital microscopy data. The animal experiments are the same as described in figure 2.
Figure 5
Figure 5. Intravital microscopy at high magnification of celecoxib-treated TRAMP-C2-GFP tumors
Tumors from celecoxib-treated mice (shown in figure 2) were imaged by intravital microscopy at high magnification. Panels A and B: H2B-GFP fluorescence of TRAMP-C2-GFP tumors showing the onset of mitosis at day 3. Bar ~25μ (A); ~10μ (B). Panels C and D: failed mitosis (C) with the nuclei becoming pycnotic at day 5 (D). Bar ~25μ (C, D).
Figure 6
Figure 6. Effect of celecoxib treatment on intra-tumoral angiogenesis
Tumors were imaged by intravital microscopy and vascular parameters were calculated. Panel A: Graphic representation of vascular parameters (area, diameter and density) for control, celecoxib-treated and celecoxib + castrated animals.
Figure 7
Figure 7. Effect of combining celecoxib and hormonal ablation by chemical castration on the growth of tumors
TRAMP-C2-GFP spheroids were co-implanted with prostrate tissue and allowed to vascularize. When there was proper flow within the tumors, mice were chemically castrated by oral administration of cyproterone acetate twice daily and injection of leuprolide acetate daily, starting at Day 0. Celecoxib was administered orally twice daily, also starting at Day 0. Panel A: Representative collage of tumor growth. Bar ~ 500μm. Panels B-C: Graphic representation of relative tumor area and intensity calculated from intravital microscopy data. Panels D-E: Apoptotic and Mitotic Index.
Figure 8
Figure 8. Effect of hormonal ablation by chemical castration on intra-tumoral angiogenesis
Tumors from the mice treated with the combination therapy as described in figure 6, were imaged by intravital microscopy and vascular parameters were calculated. Panel A: Phase contrast representative images of tumor vasculature at day 0 and day 2 post-castration. Bar~ A,B 500μm, C,D 50μm. Panel B: Graphic representation of the vascular area and the mean diameter of tumor vasculature calculated from intravital microscopy data.

Similar articles

Cited by

References

    1. Stock D, Groome PA, Siemens DR. Inflammation and prostate cancer: a future target for prevention and therapy? The Urologic clinics of North America. 2008;35(1):117–130. vii. - PubMed
    1. Furstenberger G, Krieg P, Muller-Decker K, Habenicht AJ. What are cyclooxygenases and lipoxygenases doing in the driver’s seat of carcinogenesis? International journal of cancer. 2006;119(10):2247–2254. - PubMed
    1. Harris RE. Cyclooxygenase-2 (cox-2) blockade in the chemoprevention of cancers of the colon, breast, prostate, and lung. Inflammopharmacology. 2009;17(2):55–67. - PubMed
    1. Sahin M, Sahin E, Gumuslu S. Cyclooxygenase-2 in cancer and angiogenesis. Angiology. 2009;60(2):242–253. - PubMed
    1. Pruthi RS, Wallen EM. Cyclooxygenase-2: a therapeutic target for prostate cancer. Clinical genitourinary cancer. 2005;4(3):203–211. - PubMed

Publication types

MeSH terms