. 2011 Apr 25;51(4):877-96.
doi: 10.1021/ci100462t. Epub 2011 Apr 1.

Reproducing crystal binding modes of ligand functional groups using Site-Identification by Ligand Competitive Saturation (SILCS) simulations

Affiliations

Reproducing crystal binding modes of ligand functional groups using Site-Identification by Ligand Competitive Saturation (SILCS) simulations

E Prabhu Raman et al. J Chem Inf Model. .

Abstract

The applicability of a computational method, Site Identification by Ligand Competitive Saturation (SILCS), to identify regions on a protein surface with which different types of functional groups on low-molecular weight inhibitors interact is demonstrated. The method involves molecular dynamics (MD) simulations of a protein in an aqueous solution of chemically diverse small molecules from which probability distributions of fragments types, termed FragMaps, are obtained. In the present application, SILCS simulations are performed with an aqueous solution of 1 M benzene and propane to map the affinity pattern of the protein for aromatic and aliphatic functional groups. In addition, water hydrogen and oxygen atoms serve as probes for hydrogen-bond donor and acceptor affinity, respectively. The method is tested using a set of 7 proteins for which crystal structures of complexes with several high affinity inhibitors are known. Good agreement is obtained between FragMaps and the positions of chemically similar functional groups in inhibitors as observed in the X-ray crystallographic structures. Quantitative capabilities of the SILCS approach are demonstrated by converting FragMaps to free energies, termed Grid Free Energies (GFE), and showing correlation between the GFE values and experimental binding affinities. For proteins for which ligand decoy sets are available, GFE values are shown to typically score the crystal conformation and conformations similar to it more favorable than decoys. Additionally, SILCS is tested for its ability to capture the subtle differences in ligand affinity across homologous proteins, information which may be of utility toward specificity-guided drug design. Taken together, our results show that SILCS can recapitulate the known location of functional groups of bound inhibitors for a number of proteins, suggesting that the method may be of utility for rational drug design.


Figures

Figure 1
Figure 1
Analysis of benzene fragments from SILCS simulations of trypsin. a) radial distribution function g(r), of the center of mass of benzene molecules from 0–5ns and 15–20 ns segments of all trajectories. Overlay of two benzene FragMaps constructed by dividing the b) 0–5ns and c) 15–20ns segments of trajectories into two groups shown as red and blue wireframe representations on the crystal structure of apo-trypsin. Most benzene binding sites are predicted simultaneously by both sets of trajectories indicating convergence. An arrow shows the relatively buried S1-specificity pocket.
Figure 2
Figure 2
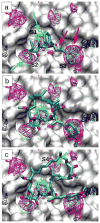
S1-pocket of trypsin is shown with benzene (purple), propane (green), hydrogen bond donor (blue) and acceptor (red) FragMaps. Four inhibitors are overlaid (a) TI-A, (b) TI-B, (c) TI-C and (d) TI-D. The position of FragMaps that overlap with inhibitor atoms are indicated by arrows colored same as the corresponding FragMap wireframes. Only polar hydrogen atoms of the inhibitors are shown for clarity and the alcohol hydrogen of 1TPP inhibitor is not shown due to the uncertainty in its position. Protein atoms occluding the view of the inhibitor-FragMap overlap are removed from the visualization. The units of ligand grid free energy score (LGFE) and experimental binding affinities (from LPDB) are kcal/mol.
Figure 3
Figure 3
Grid free energy scores computed for the crystal (red line) and surface distributed decoy (black histograms) conformations over aromatic, aliphatic, hydrogen-bond donor and hydrogen-bond acceptor atoms for four inhibitors of trypsin (marked on the left). Scores over each category of atoms are shown in the first four columns and the right column shows the sum over all as the ligand grid free energy (LGFE) score. H-bond acceptor GFE scores are not shown for TI-A, TI-B and TI-C ligands as they do not contain a hydrogen bond acceptor atom. Aliphatic GFE score is not shown for TI-A, as it does not contain methylene/methyl groups.
Figure 4
Figure 4
Grid free energy scores computed for the crystal (red line) and binding site decoy conformations (black squares) as a function of RMSD with respect to crystal conformation, over aromatic, aliphatic, hydrogen-bond donor and hydrogen-bond acceptor atoms for four inhibitors of trypsin (marked on the left). Scores over each category of atoms are shown separately and the right column shows the sum over all as the ligand grid free energy (LGFE) score.
Figure 5
Figure 5
α-thrombin FragMaps overlaid on the crystal binding mode of ligands (a) ATI-A (b) ATI-B and (c) ATI-C, (d) ATI-D, (e) ATI-E and (f) ATI-F. Benzene, propane, hydrogen bond donor and acceptor FragMaps are displayed as purple, green, blue and red wireframe representations, respectively. Arrows of the same color point to areas of overlap between the FragMaps and ligand atoms. Experimental ΔΔG values for ATI-A, B, C are from ITC experiments of Baum et. al. Experimental ΔG of ATI-D, E, F are as listed in LPDB. The units of ΔΔG, ΔG and computed LGFE are kcal/mol.
Figure 6
Figure 6
Grid free energy score computed for the crystal (red line) and surface distributed decoys (black histograms) over aromatic, aliphatic, hydrogen-bond donor and hydrogen-bond acceptor atoms for three inhibitors of α-thrombin (marked on left of each row). Sums over each category of atoms are shown in the first four columns and the right column shows the sum over all as the ligand grid free energy (LGFE) score.
Figure 7
Figure 7
Grid free energy score computed for the crystal (red line) and binding site decoys (black squares) as a function of RMSD with respect to crystal conformation, over aromatic, aliphatic, hydrogen-bond donor and hydrogen-bond acceptor atoms for three inhibitors of α-thrombin (marked on the left of each row). Scores over each category of atoms are shown separately and the right column shows the global sum over all categories as the ligand grid free energy (LGFE) score.
Figure 8
Figure 8
(a) apo (PDB 2HB4) and b) holo (PDB 1G2K) forms of HIV-protease with benzene (purple), propane (green), hydrogen bond donor (blue) and acceptor (red) FragMaps, and with 5 inhibitors (HPI-B to F) overlaid to display the canonical binding mode. Arrows display the 5 conserved hydrophobic affinity regions. c) The flap site in holo protein (PDB 1D4L) showing the overlap of conserved water molecule Wat301 and water oxygen FragMap. d) Catalytic site of holo protein showing the overlap of the potential position of alcohol hydrogen of HPI-C and hydrogen-bond donor FragMap. Arrows denote the direction of hydrogen bonds. e) apo (green) and holo (blue) forms of the protein with inhibitor HPI-A in the active site. f) Overlay of FragMaps with HPI-G (PDB 1DMP) inhibitor. Red and blue arrows show overlap with hydrogen bond acceptor and donor atoms, respectively. A GFE cutoff of −1.0 kcal/mol was used for benzene and propane FragMaps for optimal visualization.
Figure 9
Figure 9
FKBP12 in complex with a) a synthetic inhibitor (PDB 1FKG), b) FK-506 and c) rapamycin. Benzene, propane, hydrogen bond donor and acceptor FragMaps are displayed as purple, green, blue and red wireframe representations. Arrows of the same color point to areas of overlap between the FragMaps and ligand functional groups.
Figure 10
Figure 10
NadD in complex with four inhibitors a) NI-A, b) NI-B and c) NI-C and d) NI-D. Benzene, propane, hydrogen bond donor and acceptor FragMaps are displayed as purple, green, blue and red wireframe representations. Arrows of the same color point to areas of overlap between the FragMaps and ligand functional groups.
Figure 11
Figure 11
RNaseA in complex with 5 inhibitors a) RI-A, b) RI-B, c) RI-C, d) RI-D and e) RI-E. Benzene, propane, hydrogen bond donor and acceptor FragMaps are displayed as purple, green, blue and red wireframe representations. Arrows of the same color point to areas of overlap between the FragMaps and ligand functional groups.
Figure 12
Figure 12
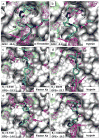
Comparison of FragMaps between homologs of the serine protease family. Benzene, propane, hydrogen bond donor and acceptor FragMaps are displayed as purple, green, blue and red wireframe representations. The α-thrombin inhibitor ATI-D is overlaid with FragMaps and protein structures of (a) α-thrombin and (b) trypsin. Conformation of inhibitor FXI-1 in complex with factor Xa (PDB 1EZQ) and trypsin (1F0U) is overlaid with the corresponding FragMaps and protein structures in (c) and (d), respectively. Conformation of FXI-2 (from trypsin co-crystal PDB 1FOT) overlaid with FragMaps and protein structure of factor Xa (trypsin) in e(f). Experimental K i values are from Ref. LGFE values are in units of kcal/mol. The “60-loop” of α-thrombin has been omitted from (a) to facilitate visualization of the ligand binding pocket.

Similar articles

Cited by

References

    1. Jorgensen WL. The many roles of computation in drug discovery. Science. 2004;303:1813–1818. - PubMed
    1. Congreve M, Chessari G, Tisi D, Woodhead AJ. Recent developments in fragment-based drug discovery. J Med Chem. 2008;51:3661–3680. - PubMed
    1. Kollman PA. Free energy calculations: Applications to chemical and biochemical phenomena. Chem Rev. 1993;93:2395–2417.
    1. Guvench O, MacKerell AD., Jr Computational evaluation of protein-small molecule binding. Curr Opin Struct Biol. 2009;19:56–61. - PMC - PubMed
    1. Erlanson DA, McDowell RS, O’Brien T. Fragment-based drug discovery. J Med Chem. 2004;47:3463–3482. - PubMed

Publication types