

Pilot study of semiautomated localization of the dermal/epidermal junction in reflectance confocal microscopy images of skin
- PMID: 21456869
- PMCID: PMC3077965
- DOI: 10.1117/1.3549740
Pilot study of semiautomated localization of the dermal/epidermal junction in reflectance confocal microscopy images of skin
Abstract
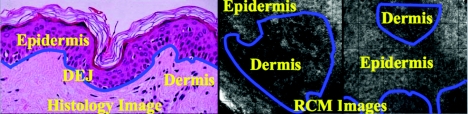
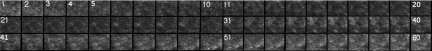
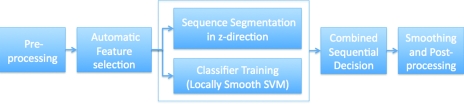
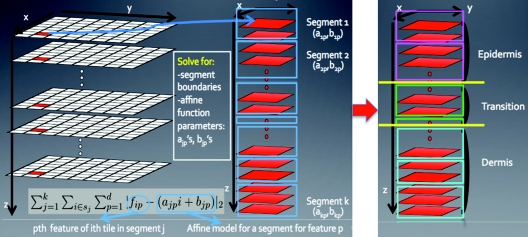
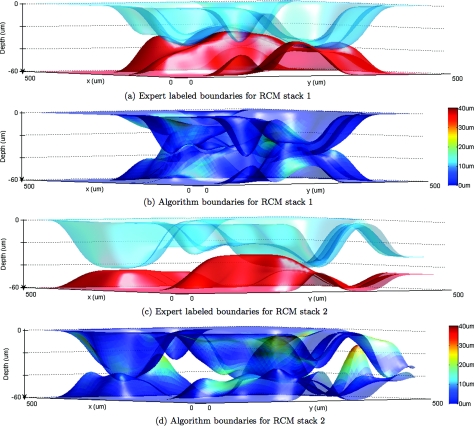
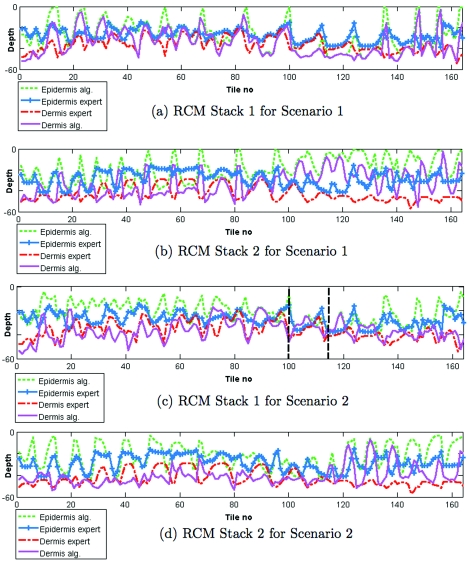
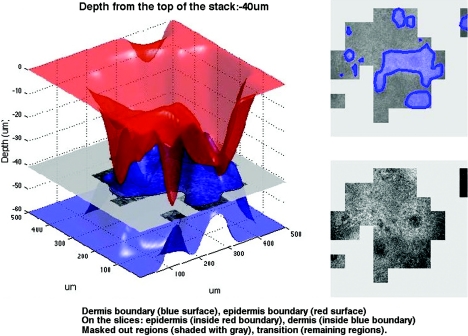
Reflectance confocal microscopy (RCM) continues to be translated toward the detection of skin cancers in vivo. Automated image analysis may help clinicians and accelerate clinical acceptance of RCM. For screening and diagnosis of cancer, the dermal/epidermal junction (DEJ), at which melanomas and basal cell carcinomas originate, is an important feature in skin. In RCM images, the DEJ is marked by optically subtle changes and features and is difficult to detect purely by visual examination. Challenges for automation of DEJ detection include heterogeneity of skin tissue, high inter-, intra-subject variability, and low optical contrast. To cope with these challenges, we propose a semiautomated hybrid sequence segmentation/classification algorithm that partitions z-stacks of tiles into homogeneous segments by fitting a model of skin layer dynamics and then classifies tile segments as epidermis, dermis, or transitional DEJ region using texture features. We evaluate two different training scenarios: 1. training and testing on portions of the same stack; 2. training on one labeled stack and testing on one from a different subject with similar skin type. Initial results demonstrate the detectability of the DEJ in both scenarios with epidermis/dermis misclassification rates smaller than 10% and average distance from the expert labeled boundaries around 8.5 μm.
Figures


Similar articles
-
Automated delineation of dermal-epidermal junction in reflectance confocal microscopy image stacks of human skin.J Invest Dermatol. 2015 Mar;135(3):710-717. doi: 10.1038/jid.2014.379. Epub 2014 Sep 3. J Invest Dermatol. 2015. PMID: 25184959 Free PMC article.
-
Validation Study of Automated Dermal/Epidermal Junction Localization Algorithm in Reflectance Confocal Microscopy Images of Skin.Proc SPIE Int Soc Opt Eng. 2012 Feb 9;8207:10.1117/12.909227. doi: 10.1117/12.909227. Proc SPIE Int Soc Opt Eng. 2012. PMID: 24376908 Free PMC article.
-
Semi-automated Algorithm for Localization of Dermal/ Epidermal Junction in Reflectance Confocal Microscopy Images of Human Skin.Proc SPIE Int Soc Opt Eng. 2011;7904:7901A. doi: 10.1117/12.875392. Proc SPIE Int Soc Opt Eng. 2011. PMID: 21709746 Free PMC article.
-
Automating reflectance confocal microscopy image analysis for dermatological research: a review.J Biomed Opt. 2022 Jul;27(7):070902. doi: 10.1117/1.JBO.27.7.070902. J Biomed Opt. 2022. PMID: 35879817 Free PMC article. Review.
-
Role of In Vivo Reflectance Confocal Microscopy in the Analysis of Melanocytic Lesions.Acta Dermatovenerol Croat. 2018 Apr;26(1):64-67. Acta Dermatovenerol Croat. 2018. PMID: 29782304 Review.
Cited by
-
The skin through reflectance confocal microscopy - Historical background, technical principles, and its correlation with histopathology.An Bras Dermatol. 2022 Nov-Dec;97(6):697-703. doi: 10.1016/j.abd.2021.10.010. Epub 2022 Sep 21. An Bras Dermatol. 2022. PMID: 36153173 Free PMC article. Review.
-
A Marked Poisson Process Driven Latent Shape Model for 3D Segmentation of Reflectance Confocal Microscopy Image Stacks of Human Skin.IEEE Trans Image Process. 2017 Jan;26(1):172-184. doi: 10.1109/TIP.2016.2615291. Epub 2016 Oct 5. IEEE Trans Image Process. 2017. PMID: 27723590 Free PMC article.
-
Automated delineation of dermal-epidermal junction in reflectance confocal microscopy image stacks of human skin.J Invest Dermatol. 2015 Mar;135(3):710-717. doi: 10.1038/jid.2014.379. Epub 2014 Sep 3. J Invest Dermatol. 2015. PMID: 25184959 Free PMC article.
-
Validation Study of Automated Dermal/Epidermal Junction Localization Algorithm in Reflectance Confocal Microscopy Images of Skin.Proc SPIE Int Soc Opt Eng. 2012 Feb 9;8207:10.1117/12.909227. doi: 10.1117/12.909227. Proc SPIE Int Soc Opt Eng. 2012. PMID: 24376908 Free PMC article.
-
Skin strata delineation in reflectance confocal microscopy images using recurrent convolutional networks with attention.Sci Rep. 2021 Jun 15;11(1):12576. doi: 10.1038/s41598-021-90328-x. Sci Rep. 2021. PMID: 34131165 Free PMC article.
References
-
- Gonzalez S. G., Gill M., and Halpern A., Reflectance Confocal Microscopy of Cutaneous Tumors—An Atlas with Clinical, Dermoscopic and Histological Correlations, Informa Healthcare, London: (2008).
-
- Nori S., Rius-Díaz F., Cuevas J., Goldgeier M., Jaen P., Torres A., and González S., “Sensitivity and specificity of reflectance-mode confocal microscopy for in vivo diagnosis of basal cell carcinoma: A multicenter study,” J. Am. Acad. Dermatol. 51, 923–930 (2004).10.1016/j.jaad.2004.06.028 - DOI - PubMed
Publication types
MeSH terms
Grants and funding
LinkOut - more resources
Full Text Sources
Other Literature Sources
