Comparative Study
. 2011 Apr 2:12:174.
doi: 10.1186/1471-2164-12-174.

A high-resolution linkage map for comparative genome analysis and QTL fine mapping in Asian seabass, Lates calcarifer

Affiliations
Comparative Study

A high-resolution linkage map for comparative genome analysis and QTL fine mapping in Asian seabass, Lates calcarifer

Chun Ming Wang et al. BMC Genomics. .

Abstract

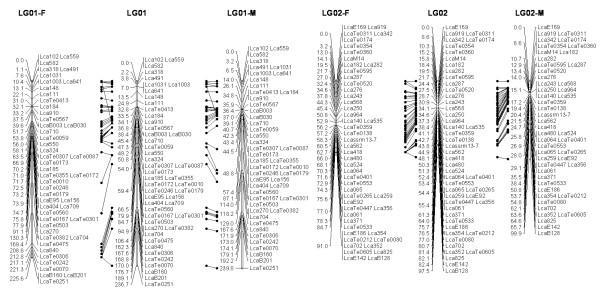
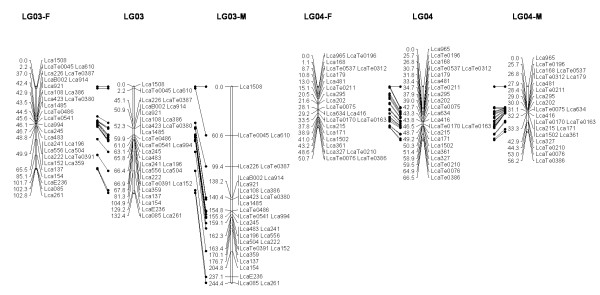
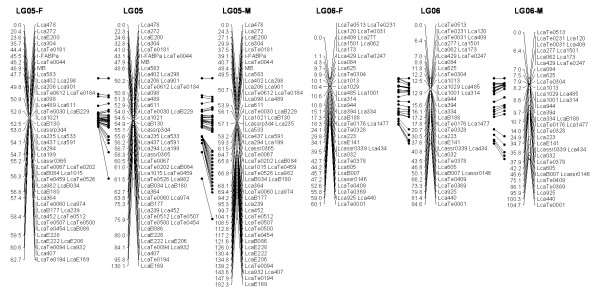
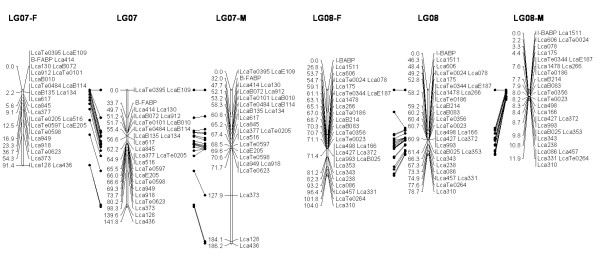
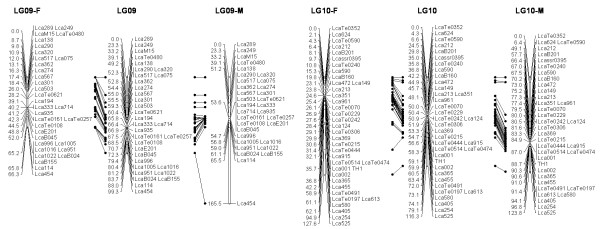
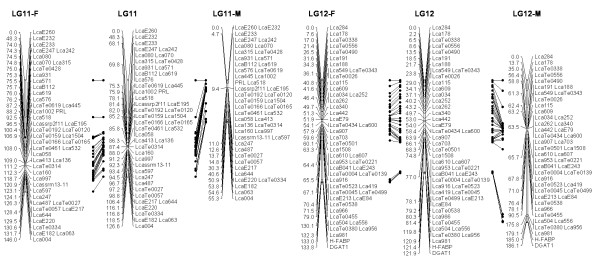
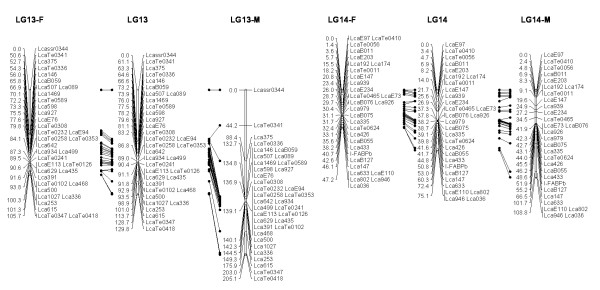
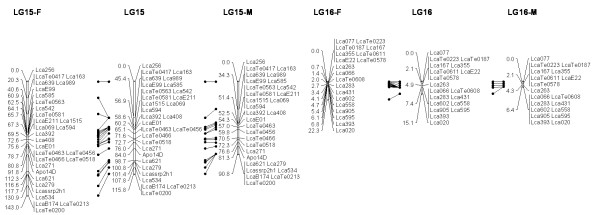
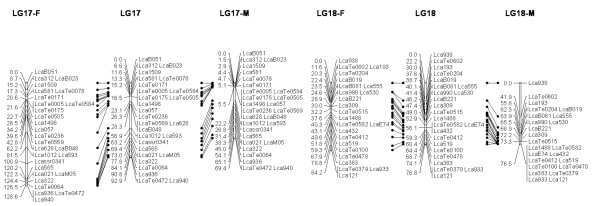
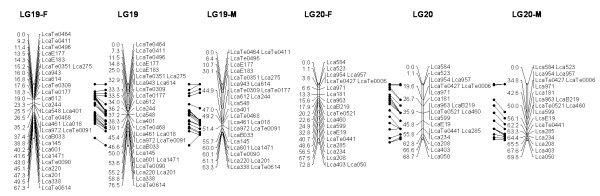
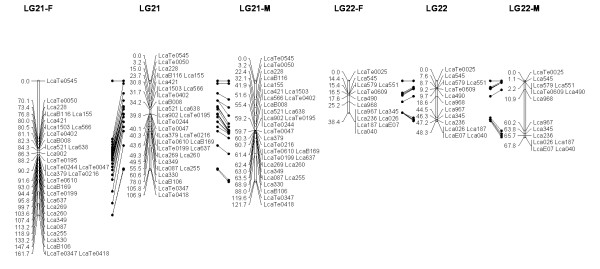
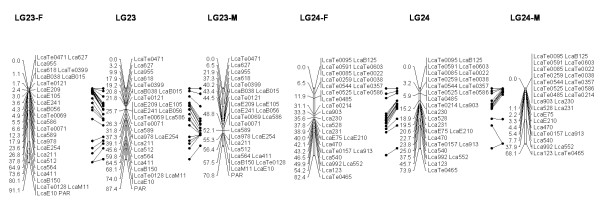
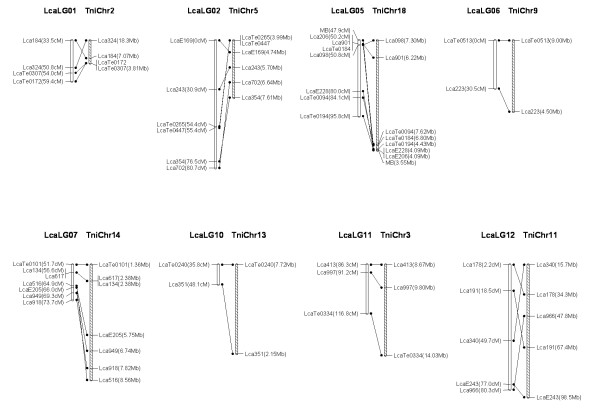
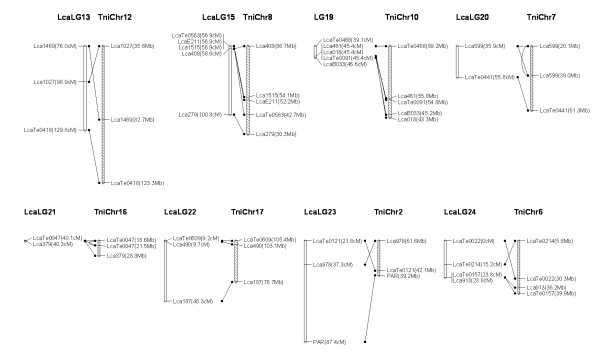
Background: High density linkage maps are essential for comparative analysis of synteny, fine mapping of quantitative trait loci (QTL), searching for candidate genes and facilitating genome sequence assembly. However, in most foodfish species, marker density is still low. We previously reported a first generation linkage map with 240 DNA markers and its application to preliminarily map QTL for growth traits in Asian seabass (Lates calcarifer). Here, we report a high-resolution linkage map with 790 microsatellites and SNPs, comparative analysis of synteny, fine-mapping of QTL and the identification of potential candidate genes for growth traits.

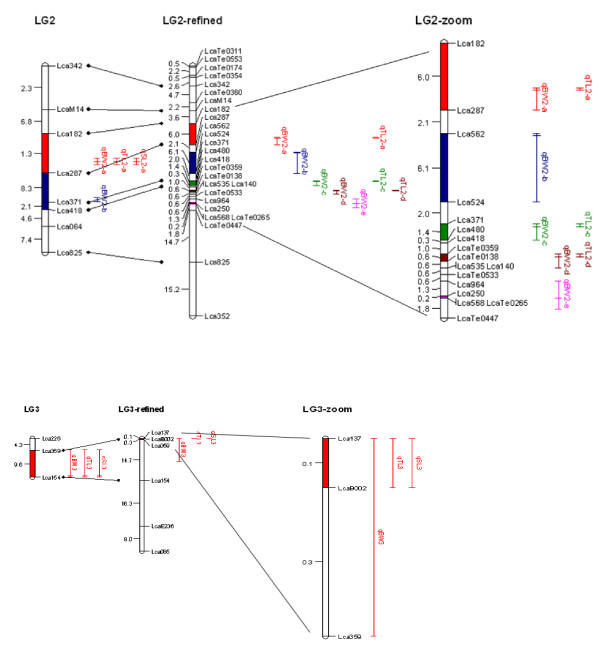
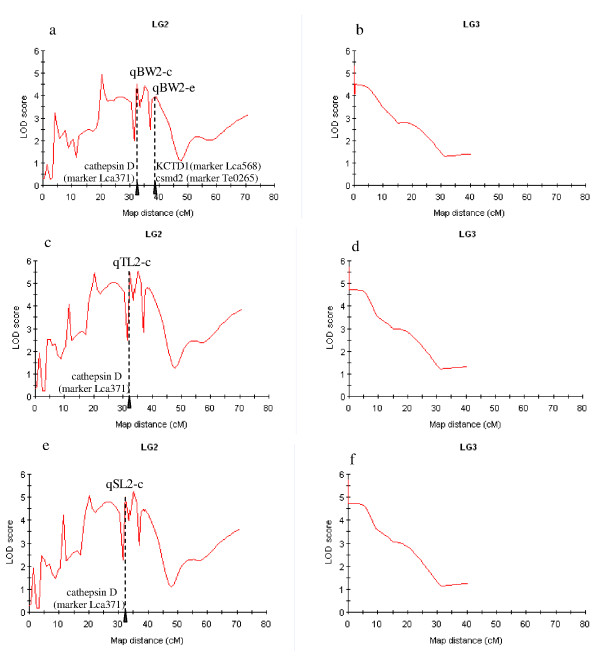
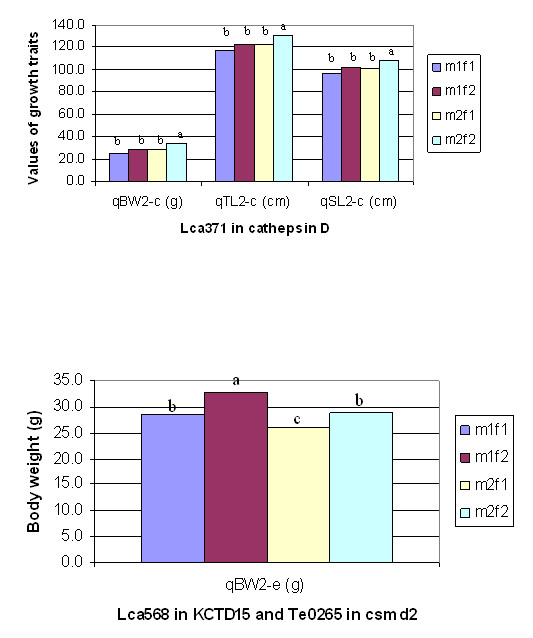
Results: A second generation linkage map of Asian seabass was developed with 790 microsatellite and SNP markers. The map spanned a genetic length of 2411.5 cM, with an average intermarker distance of 3.4 cM or 1.1 Mb. This high density map allowed for comparison of the map with Tetraodon nigroviridis genome, which revealed 16 synteny regions between the two species. Moreover, by employing this map we refined QTL to regions of 1.4 and 0.2 cM (or 400 and 50 kb) in linkage groups 2 and 3 in a population containing 380 progeny; potential candidate genes for growth traits in QTL regions were further identified using comparative genome analysis, whose effects on growth traits were investigated. Interestingly, a QTL cluster at Lca371 underlying growth traits of Asian seabass showed similarity to the cathepsin D gene of human, which is related to cancer and Alzheimer's disease.

Conclusions: We constructed a high resolution linkage map, carried out comparative mapping, refined the positions of QTL, identified candidate genes for growth traits and analyzed their effects on growth. Our study developed a framework that will be indispensable for further identification of genes and analysis of molecular variation within the refined QTL to enhance understanding of the molecular basis of growth and speed up genetic improvement of growth performance, and it also provides critical resource for future genome sequence assembly and comparative genomics studies on the evolution of fish genomes.


Figures

Figure 1
Figure 1
The second generation linkage map of Asian seabass (LGs 1-2). Female (F) and male (M) maps are shown on the left and right, respectively, and the consensus map is shown in the center. The same loci are connected with solid lines.
Figure 2
Figure 2
The second generation linkage map of Asian seabass (LGs 3-4).
Figure 3
Figure 3
The second generation linkage map of Asian seabass (LGs 5-6).
Figure 4
Figure 4
The second generation linkage map of Asian seabass (LGs 7-8).
Figure 5
Figure 5
The second generation linkage map of Asian seabass (LGs 9-10).
Figure 6
Figure 6
The second generation linkage map of Asian seabass (LGs 11-12).
Figure 7
Figure 7
The second generation linkage map of Asian seabass (LGs 13-14).
Figure 8
Figure 8
The second generation linkage map of Asian seabass (LGs 15-16).
Figure 9
Figure 9
The second generation linkage map of Asian seabass (LGs 17-18).
Figure 10
Figure 10
The second generation linkage map of Asian seabass (LGs 19-20).
Figure 11
Figure 11
The second generation linkage map of Asian seabass (LGs 21-21).
Figure 12
Figure 12
The second generation linkage map of Asian seabass (LGs 23-24).
Figure 13
Figure 13
Lates calcarifer (Lca) linkage map and Tetraodon nigroviridis (Tni) synteny. Homologous Lca (empty) and Tni (dashed) chromosomes are shown with lines connecting homologous markers.
Figure 14
Figure 14
Lates calcarifer (Lca) linkage map and Tetraodon nigroviridis (Tni) synteny (continued). Homologous Lca (empty) and Tni (dashed) chromosomes are shown with lines connecting homologous markers.
Figure 15
Figure 15
QTL for growth traits identified on Asian seabass. See Table 2 for details about the effects of QTL. The position of the QTL is indicated on the right of the linkage groups. The QTL bars indicate experiment-wise LOD support confidence interval in which the inner line indicates position of maximum LOD score. The highlighted region on LGs shows QTL interval between two flanking markers. The peaks of qBW2-a and BW2-b were flanked by Lca182 and Lca287, and closely linked to Lca287 with a distance of 2 cM. The peaks of the other QTL (qBW2-b, c, d, e and qBW3) were detected near the positions of markers Lca562, Lca371, Te0359, Lca250 and Lca137.
Figure 16
Figure 16
Mapping of QTL for growth traits. a, QTL for body weight on LG2; b, QTL for body weight on LG3; c, QTL for total length on LG2; d, QTL for total length on LG3; e, QTL for standard length on LG2; f, QTL for standard length on LG3. The lines were drawn by plotting the LOD scores at each marker as well as at 1.0 cM intervals along the linkage group. The arrow shows the position of genes and their markers where overlapped with QTL peaks.
Figure 17
Figure 17
The effects of genotypes of cathepsin D (left), KCTD15 and csmd2 (right). The letters on the top of bars indicate the level of difference in phenotypic value between genotypes. The same letter indicates that the difference is statistically insignificant, whereas different letters represent statistically significant (Bonferroni T tests at α <0.01) difference.

Similar articles

Cited by

References

    1. Falconer DS, Mackay TFC. Introduction to Quantitative Genetics. Fourth. Harlow, Essex, UK: Addison Wesley Longman; 1996.
    1. Paterson AH, DeVerna JW, Lanini B, Tanksley SD. Fine mapping of quantitative trait loci using selected overlapping recombinant chromosomes, in an interspecies cross of tomato. Genetics. 1990;124(3):735–742. - PMC - PubMed
    1. Varshney RK, Tuberosa R, (eds) Genomics-Assisted Crop Improvement- Vol 2: Genomics Applications in Crops. Netherlands: Springer; 2007.
    1. Lander ES, Green P, Abrahamson J, Barlow A, Daly MJ, Lincoln SE, Newburg L. MAPMAKER: An interactive computer package for constructing primary genetic linkage maps of experimental and natural populations. Genomics. 1987;1:174–181. doi: 10.1016/0888-7543(87)90010-3. - DOI - PubMed
    1. Tautz D. Hypervariabflity of simple sequences as a general source for polymorphic DNA markers. Nucl Acids Res. 1989;17(16):6463. doi: 10.1093/nar/17.16.6463. - DOI - PMC - PubMed

Publication types

Substances

LinkOut - more resources