Comparative Study
. 2011 Apr 8;88(4):440-9.
doi: 10.1016/j.ajhg.2011.03.004. Epub 2011 Mar 31.

Improving the assessment of the outcome of nonsynonymous SNVs with a consensus deleteriousness score, Condel

Affiliations
Comparative Study

Improving the assessment of the outcome of nonsynonymous SNVs with a consensus deleteriousness score, Condel

Abel González-Pérez et al. Am J Hum Genet. .

Abstract

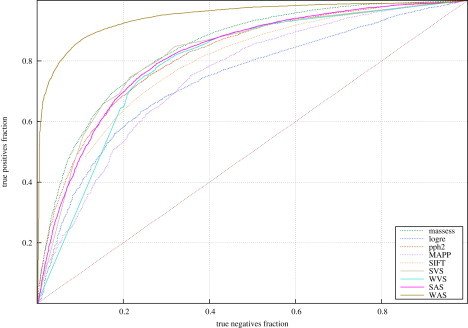
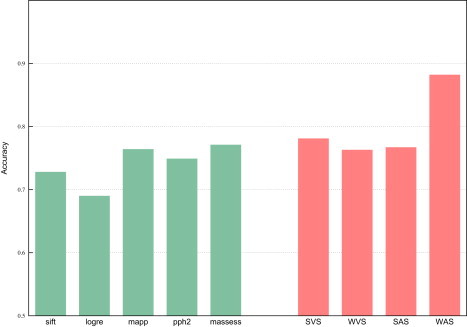
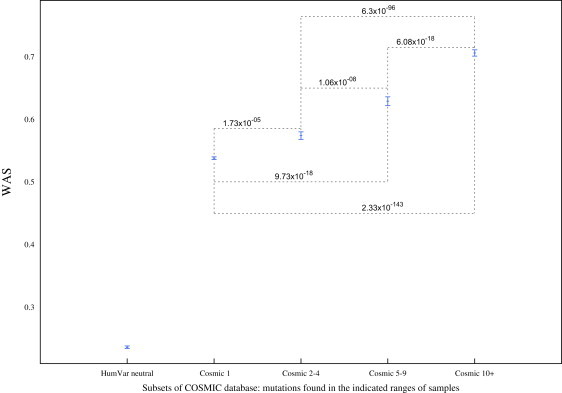
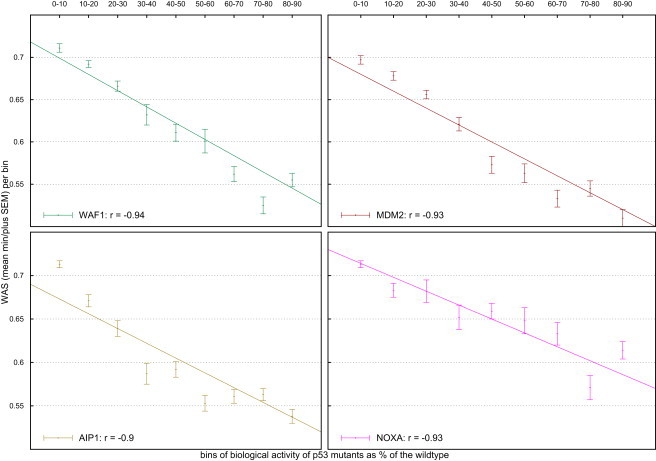
Several large ongoing initiatives that profit from next-generation sequencing technologies have driven--and in coming years will continue to drive--the emergence of long catalogs of missense single-nucleotide variants (SNVs) in the human genome. As a consequence, researchers have developed various methods and their related computational tools to classify these missense SNVs as probably deleterious or probably neutral polymorphisms. The outputs produced by each of these computational tools are of different natures and thus difficult to compare and integrate. Taking advantage of the possible complementarity between different tools might allow more accurate classifications. Here we propose an effective approach to integrating the output of some of these tools into a unified classification; this approach is based on a weighted average of the normalized scores of the individual methods (WAS). (In this paper, the approach is illustrated for the integration of five tools.) We show that this WAS outperforms each individual method in the task of classifying missense SNVs as deleterious or neutral. Furthermore, we demonstrate that this WAS can be used not only for classification purposes (deleterious versus neutral mutation) but also as an indicator of the impact of the mutation on the functionality of the mutant protein. In other words, it may be used as a deleteriousness score of missense SNVs. Therefore, we recommend the use of this WAS as a consensus deleteriousness score of missense mutations (Condel).


Figures

Figure 1
Figure 1
ROC Curves Produced by the Five Tools and the Four Integrated Scores with the HumVar Dataset
Figure 2
Figure 2
Accuracy with which the Five Tools and the Four Integrated Scores Classify the Hum Var Dataset Green bars: accuracy of individual methods. Red bars: accuracy of integrated scores.
Figure 3
Figure 3
Comparison of the WAS of Four Disjoint Sets of Mutations from the Cosmic Database and the WAS of HumVar Neutral Mutations The five sets consist, respectively, of the neutral mutations in HumVar, the mutations appearing in only one sample (1), those appearing in two to four samples (2–4), those appearing in five to nine samples (5–9), and those appearing in ten or more samples (10+) in the Cosmic database. The points represent the mean WAS; the error bars represent the standard error of the mean. The weights were computed from the HumVar dataset. The p values resulting from the Wilcoxon-Mann-Whitney test of each group-group comparison are shown in the graph. (All comparisons including neutral polymorphisms yielded p values smaller than 10−318.)
Figure 4
Figure 4
Correlation between the WAS and the Biological Activity of Bins of TP53 Mutants Mutants' activity measured as their ability to trans-activate transcription at four yeast promoters (WAF1, MDM2, AIP1, and NOXA) is given as a percent of the wild-type activity. The points represent the mean WAS; the error bars represent the standard error of the mean.
Figure 5
Figure 5
Mutational Landscape of the C-Terminal Half of the DNA-Binding Domain of p53 The abscissa of all graphs represents the position within the sequence. The bottom graph depicts the mean WAS of mutants at each position, and the other four graphs contain the mean biological activity, measured as the trans-activation of transcription at four yeast promoters (WAF1, MDM2, AIP1, and NOXA, from top to bottom). Only 0.5% of the neutral mutations in HumVar score at or above the WAS value marked by the red line in the bottom graph; vertical broken lines show the positions with mean WAS greater than this value.

Similar articles

Cited by

References

    1. Cancer Genome Atlas Research Network Comprehensive genomic characterization defines human glioblastoma genes and core pathways. Nature. 2008;455:1061–1068. - PMC - PubMed
    1. Hudson T.J., Anderson W., Artez A., Barker A.D., Bell C., Bernabe R.R., Bhan M.K., Calvo F., Eerola I., Gerhard D.S. International network of cancer genome projects. Nature. 2010;464:993–998. - PMC - PubMed
    1. Durbin R.M., Abecasis G.R., Altshuler D.L., Auton A., Brooks L.D., Gibbs R.A., Hurles M.E., McVean G.A. A map of human genome variation from population-scale sequencing. Nature. 2010;467:1061–1073. - PMC - PubMed
    1. Ng S.B., Bigham A.W., Buckingham K.J., Hannibal M.C., McMillin M.J., Gildersleeve H.I., Beck A.E., Tabor H.K., Cooper G.M., Mefford H.C. Exome sequencing identifies MLL2 mutations as a cause of Kabuki syndrome. Nat. Genet. 2010;42:790–793. - PMC - PubMed
    1. Ng S.B., Buckingham K.J., Lee C., Bigham A.W., Tabor H.K., Dent K.M., Huff C.D., Shannon P.T., Jabs E.W., Nickerson D.A. Exome sequencing identifies the cause of a Mendelian disorder. Nat. Genet. 2010;42:30–35. - PMC - PubMed

Publication types